National High School Design Competition

SORT BY:
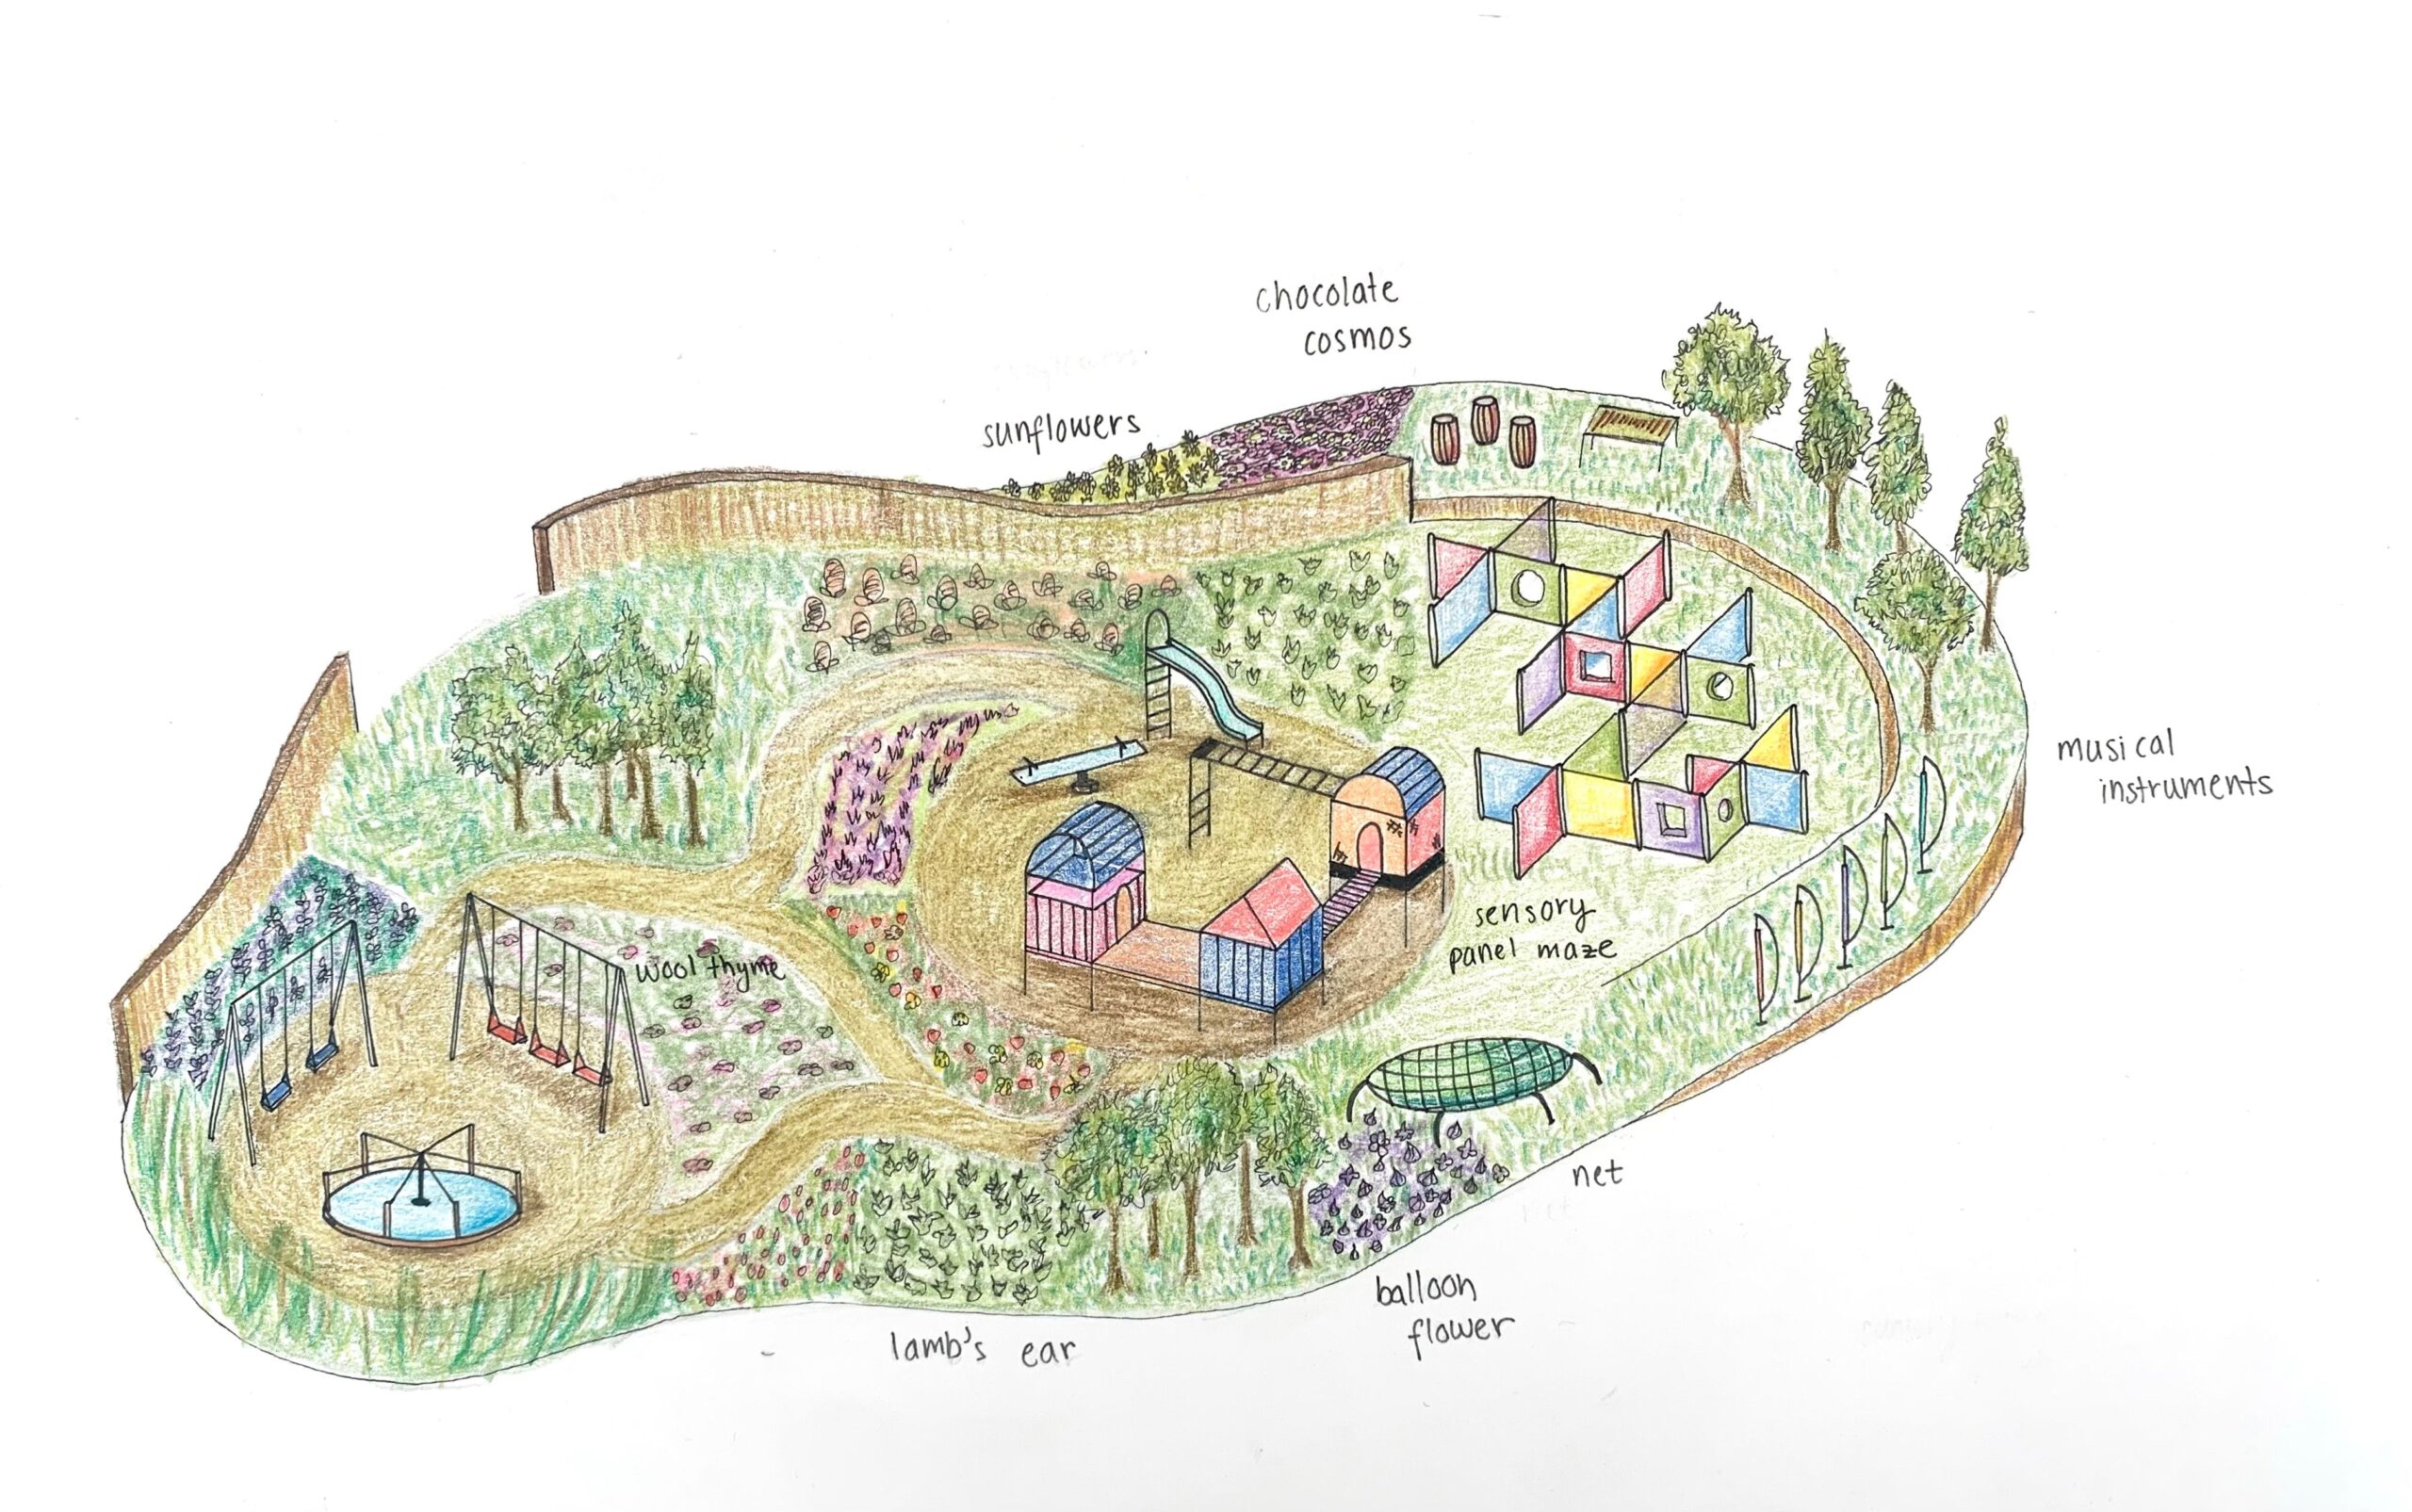
When this bag is disassembled, it can be inflated into an air mattress using the built-in pump attached to the bag. The bag is covered with a blanket, and there is a camping tent set included inside the bag.
Honorable Mention
Hyunseo Ryu, grade 10 Bergen County Academies, Hackensack, NJ Teacher: Scott Lang This design is for people who don’t have a house and for people who want to feel comfortable outside of their houses. Beds are deeply associated with the concept of home and comfort. This design is a bag that can turn into a...
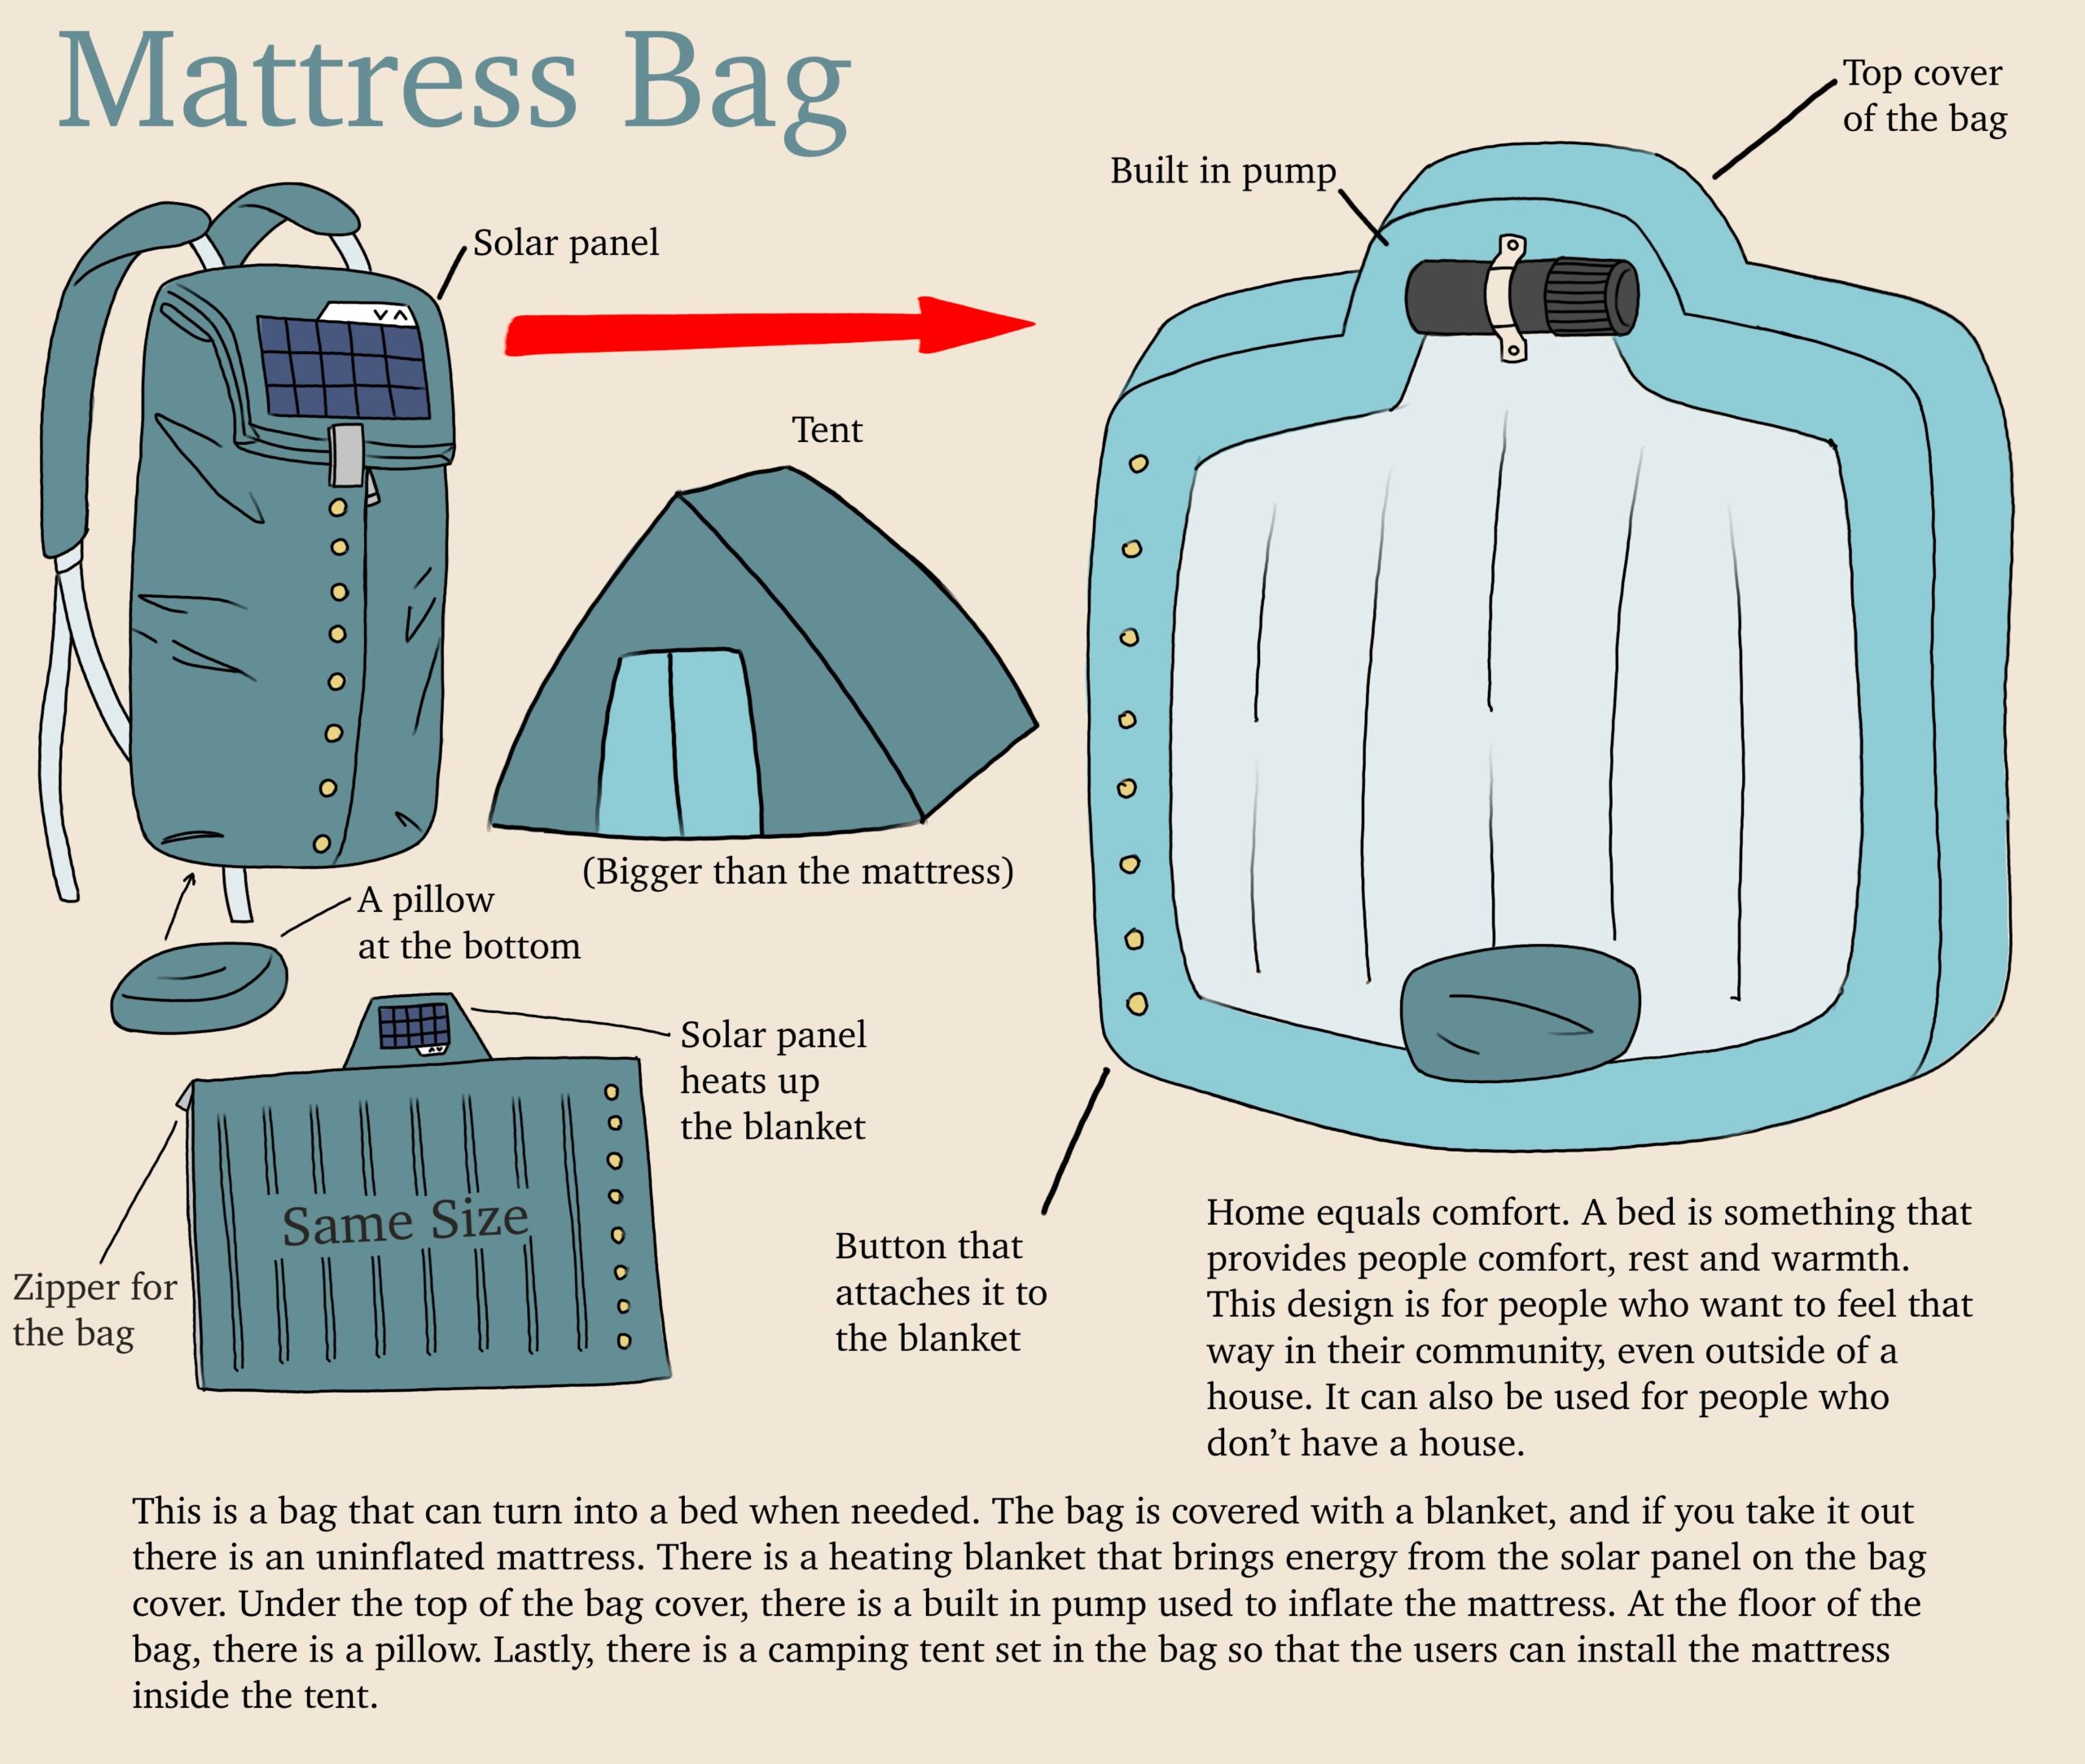
A sensory playground in which kids can interact with plants like the balloon flower, which pops when squeezed, and chocolate cosmos, which smell like chocolate, while a sensory panel maze encourages problem-solving and audiovisual engagement.
Honorable Mention
Sophie Takano, grade 12 and Kavita Amin, grade 12 Princeton Day School, Princeton, NJ Sensory-related disorders, including hearing loss, ADHD, and autism, are becoming increasingly prevalent among children. Sensory playgrounds not only provide a safe and inclusive environment but also support all children in developing an understanding of the world through play. Our design provides...

Honorable Mention
Anqi Xie, grade 12 La Jolla Country Day High School, La Jolla, CA Teacher: Casey Walker For immigrants, moving across the world to the United States is a tremendous change. The language, culture, and cuisine are different. A community garden for immigrant families offers a space to grow culturally significant, organic produce. Located in an...
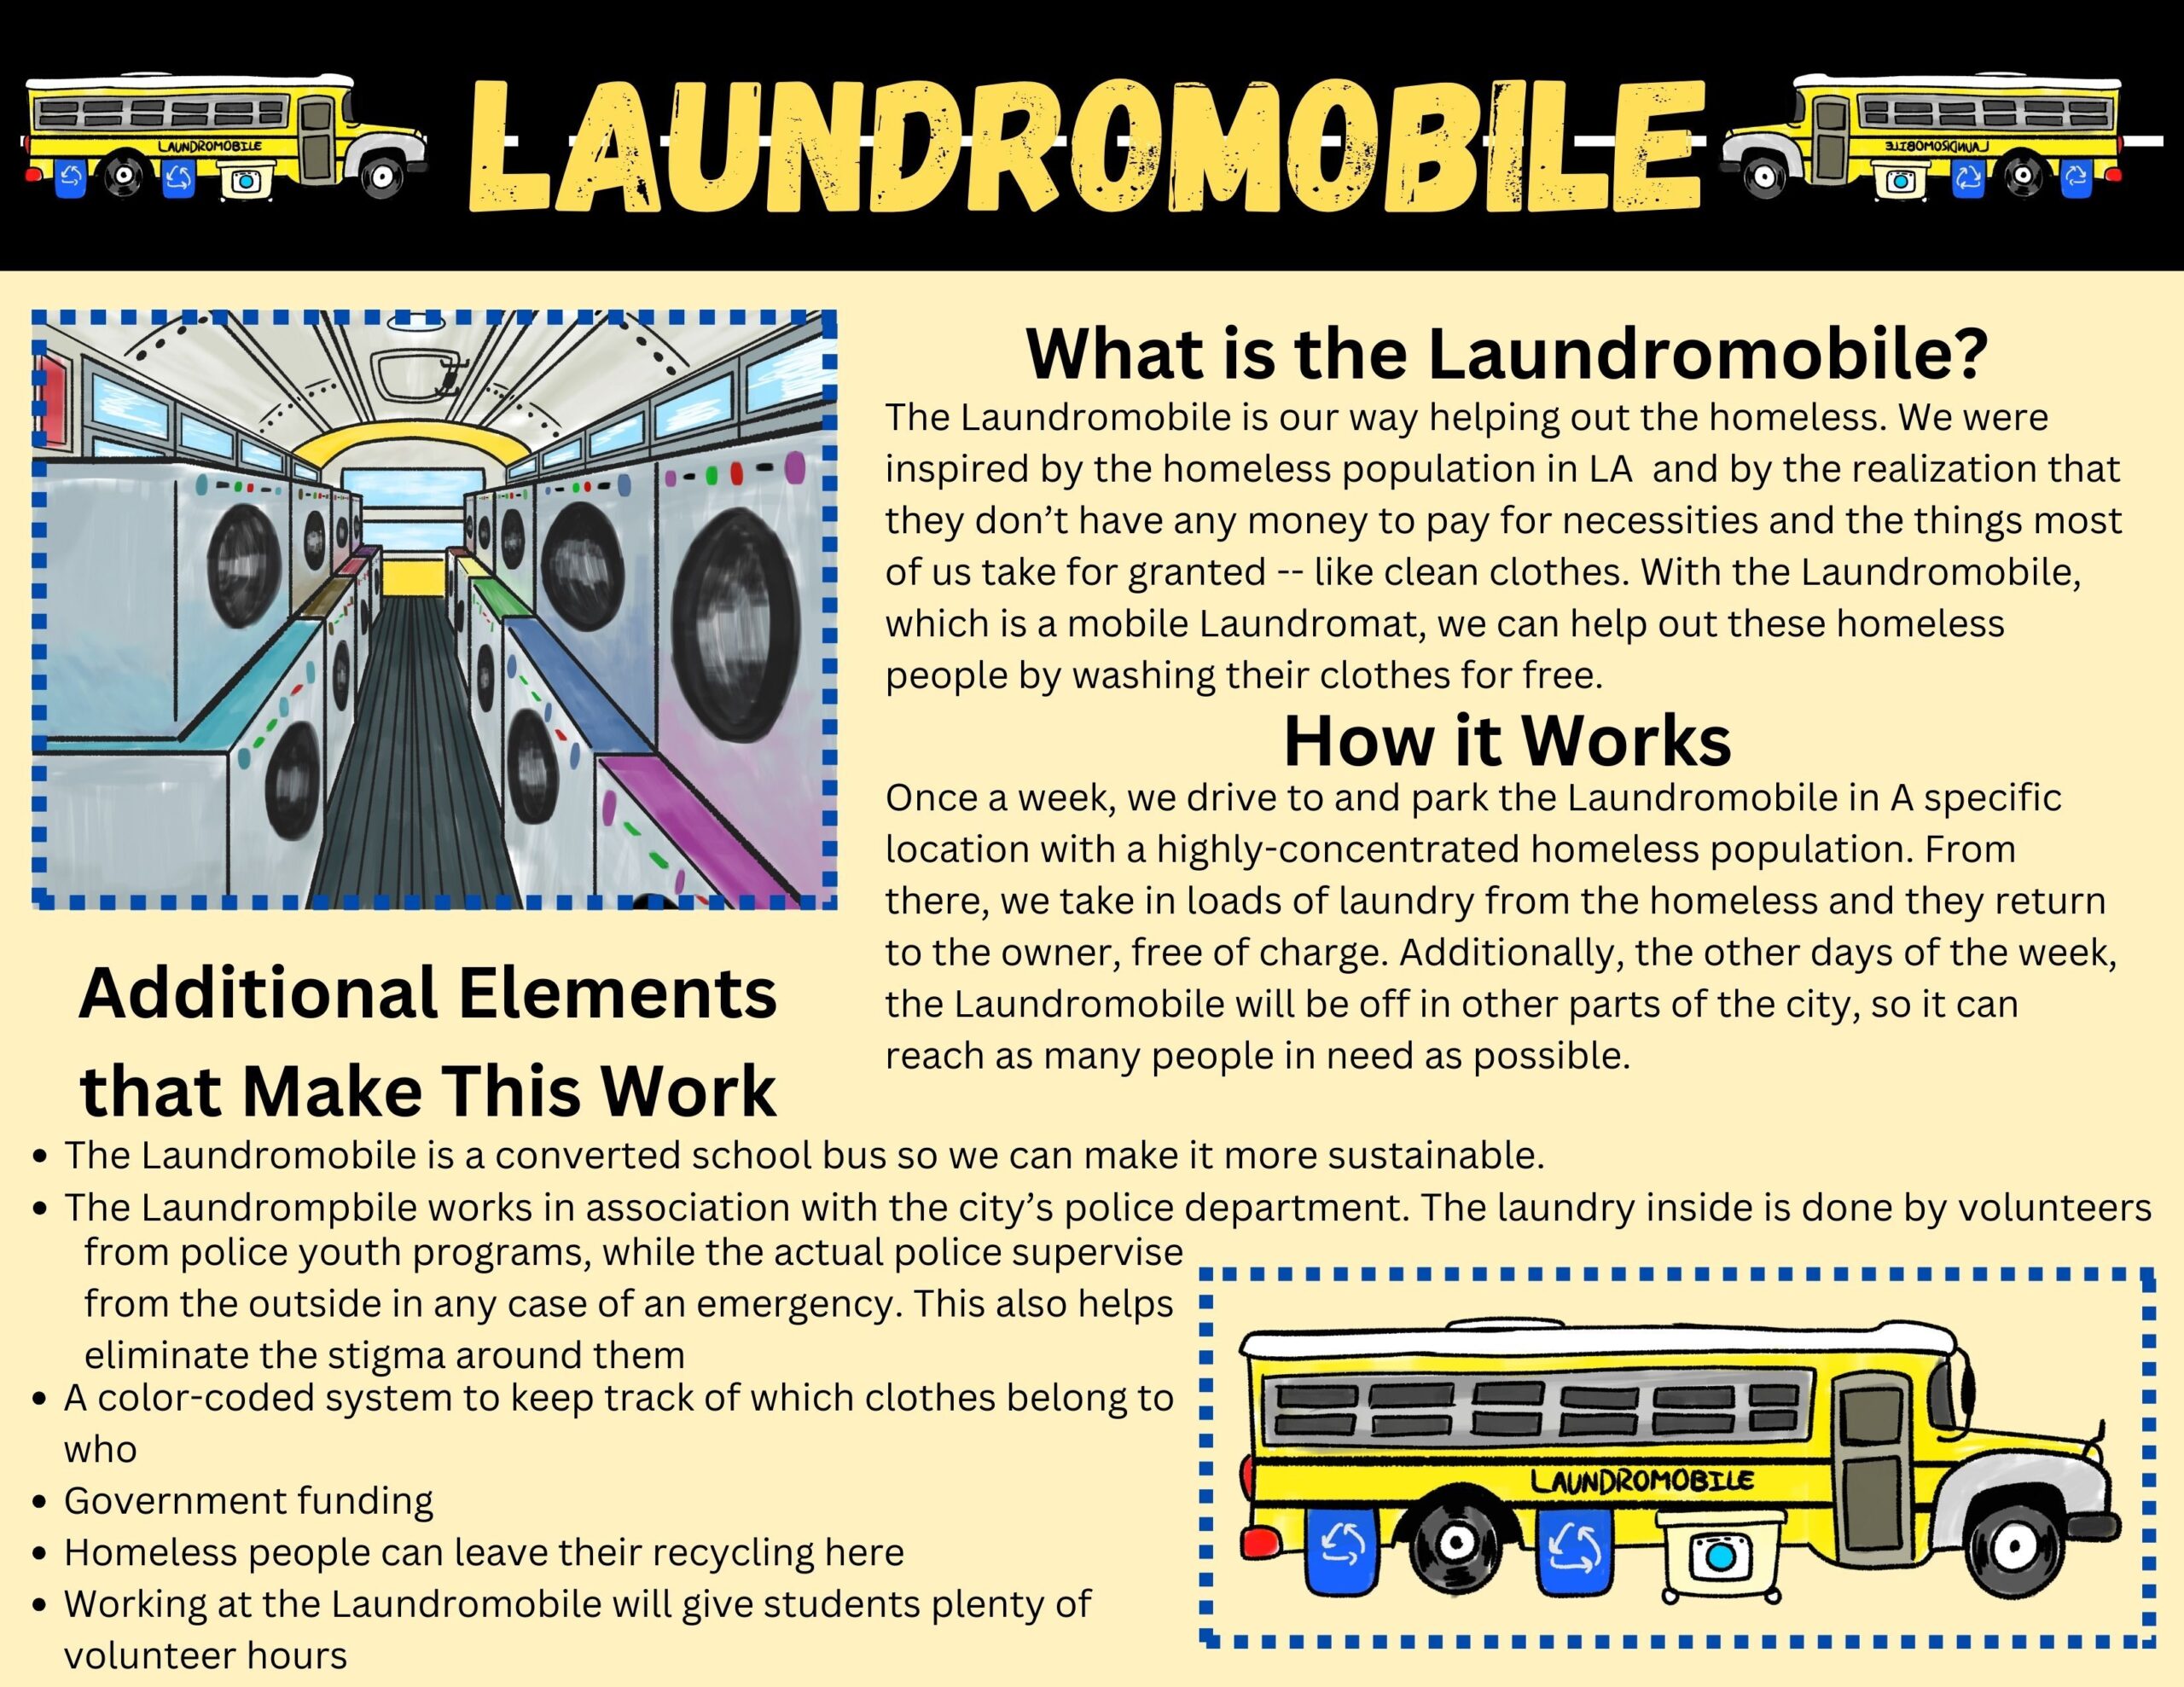
Our design is a mobile laundromat that is strategically moved to areas with high concentrations of people experiencing homelessness so they can wash their clothes without charge.
Honorable Mention
Charlotte Yeung, grade 10 and Marco Mas, grade 10 Granada Hills Charter High School, Granada Hills, CA Teacher: Narae Kim California is experiencing a homelessness crisis. Our design is a mobile laundromat that is strategically moved to areas with high concentrations of people experiencing homelessness so they can wash their clothes without charge. In doing...
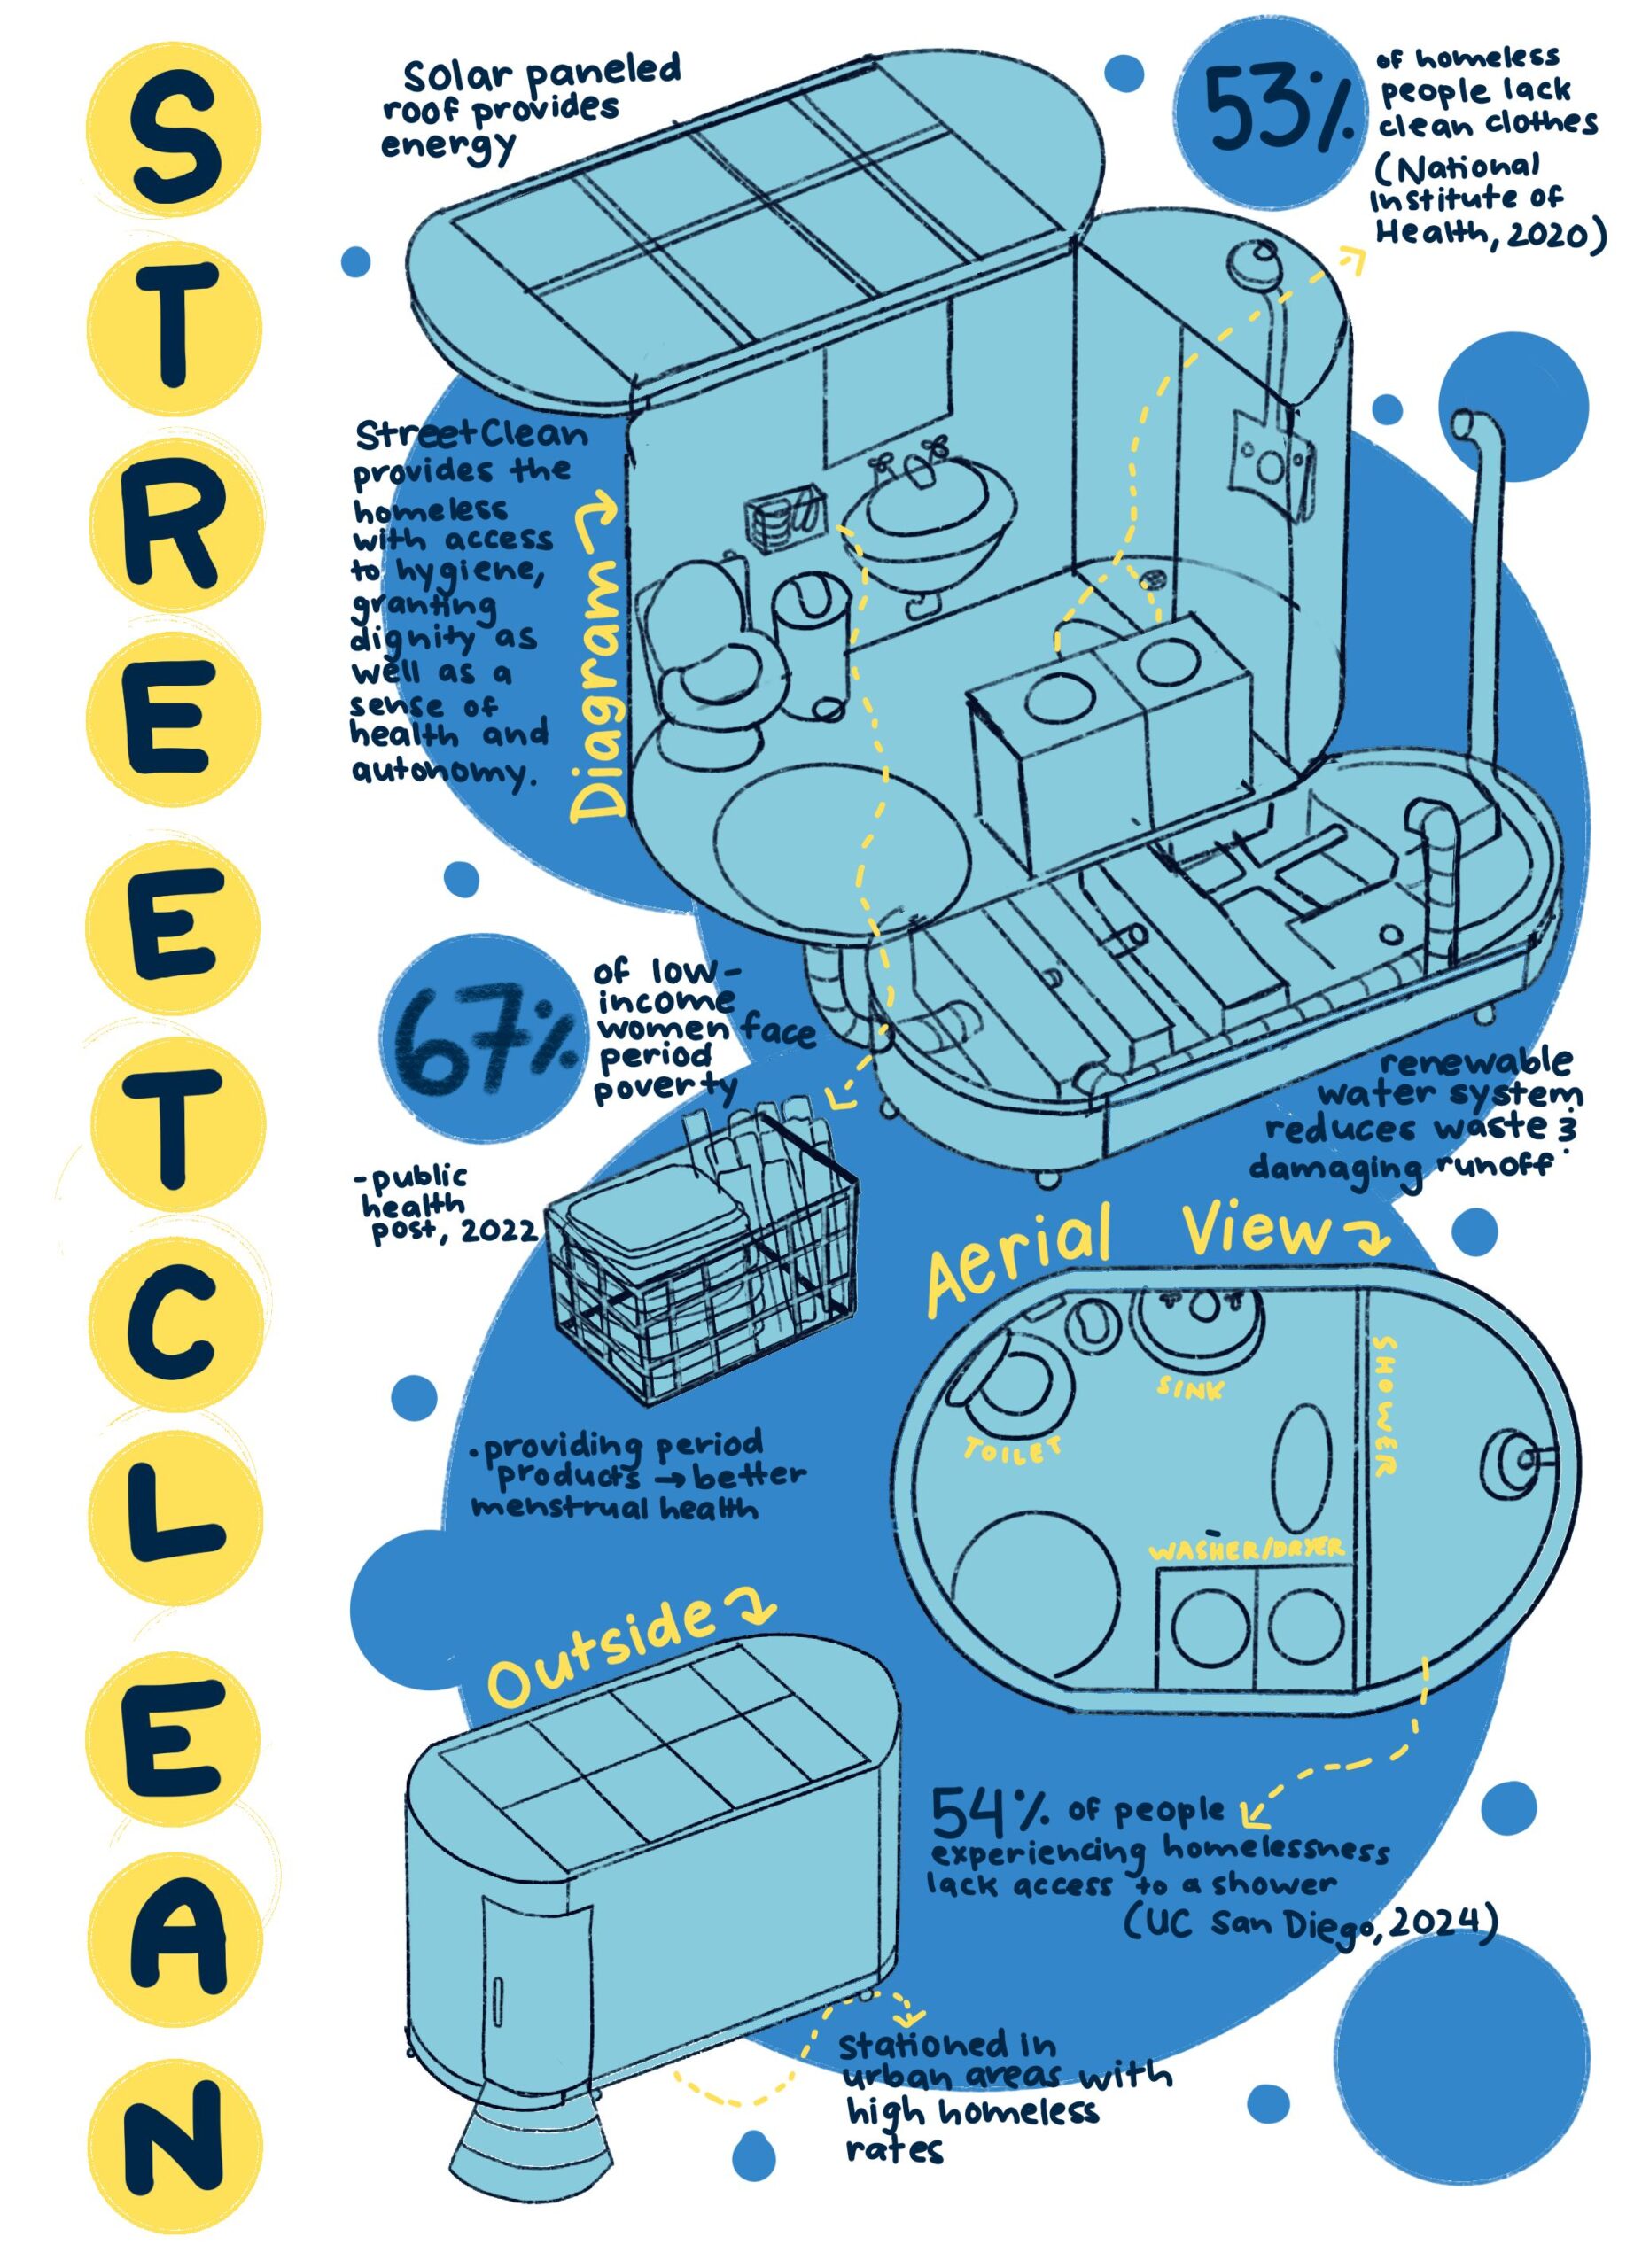
StreetClean is a compact, portable, and sustainable restroom designed to assist urban homeless populations. The design provides a shower, toilet, and sink, all using a renewable water-conserving system concealed at the bottom of the structure and powered by solar energy. It also provides period products to support the menstrual health of women experiencing homelessness.
Honorable Mention
Mia Zhou, grade 11 Millburn High School, Millburn, NJ StreetClean is a compact, portable, and sustainable restroom designed to assist urban homeless populations. After volunteering with homeless communities, I learned that many adults feel a loss of autonomy because they lack access to hygiene. StreetClean could improve not only the health but also the dignity...

Winner
Eleanor Lewis, grade 12 Design and Architecture Senior High, Miami, FL Teacher: Eric Hankin I am visualizing the effects of climate change on plant life in South Florida. I designed the Plant Resilient Project’s website. It uses satellite data tracking heat islands and saltwater intrusion. Users can map where non-heat tolerant or saltwater tolerant plants...
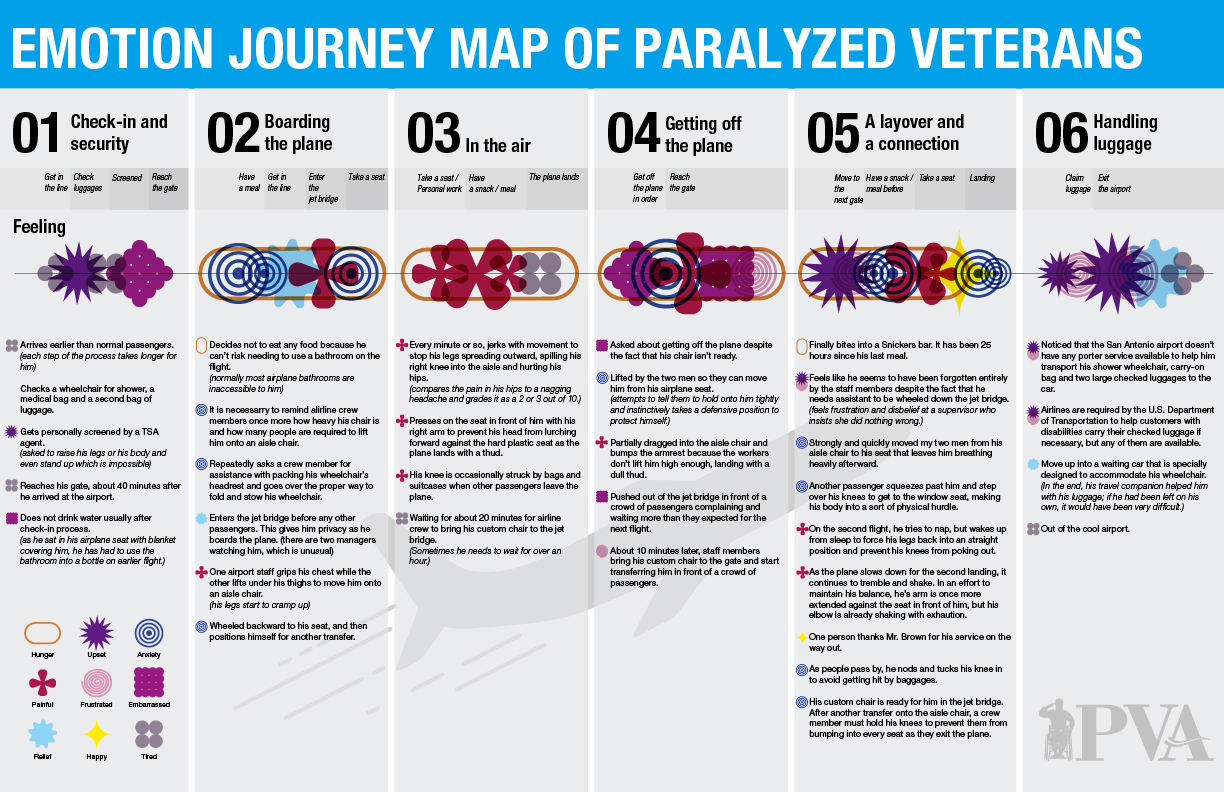
Our design visualizes the experiences of disabled veterans boarding airplanes. We used data from a New York Times article showing the hardships of Charles Brown, a paralyzed veteran. We created a customer journey map showing emotions of this veteran’s experiences when boarding an airplane. With this data visualization, we wanted to support Paralyzed Veterans of America. We represented each emotion that a disabled veteran may feel while boarding an airplane with a symbol. We analyzed each task and action during this process. We then created a pattern of overlapping emotions. This pattern becomes a sequence. Our infographic will help airplane users be more attentive and thoughtful toward all disabled fliers. Users can access this infographic through pamphlets or booklets placed in airplane seats.
Finalist
Yoona Lee, grade 11, St. Paul’s School, Concord, NH, and Yoojung Shin, grade 10, Phillips Academy Andover, Andover, MA Our design visualizes the experiences of disabled veterans boarding airplanes. We used data from a New York Times article showing the hardships of Charles Brown, a paralyzed veteran. We created a customer journey map showing emotions...
Finalist
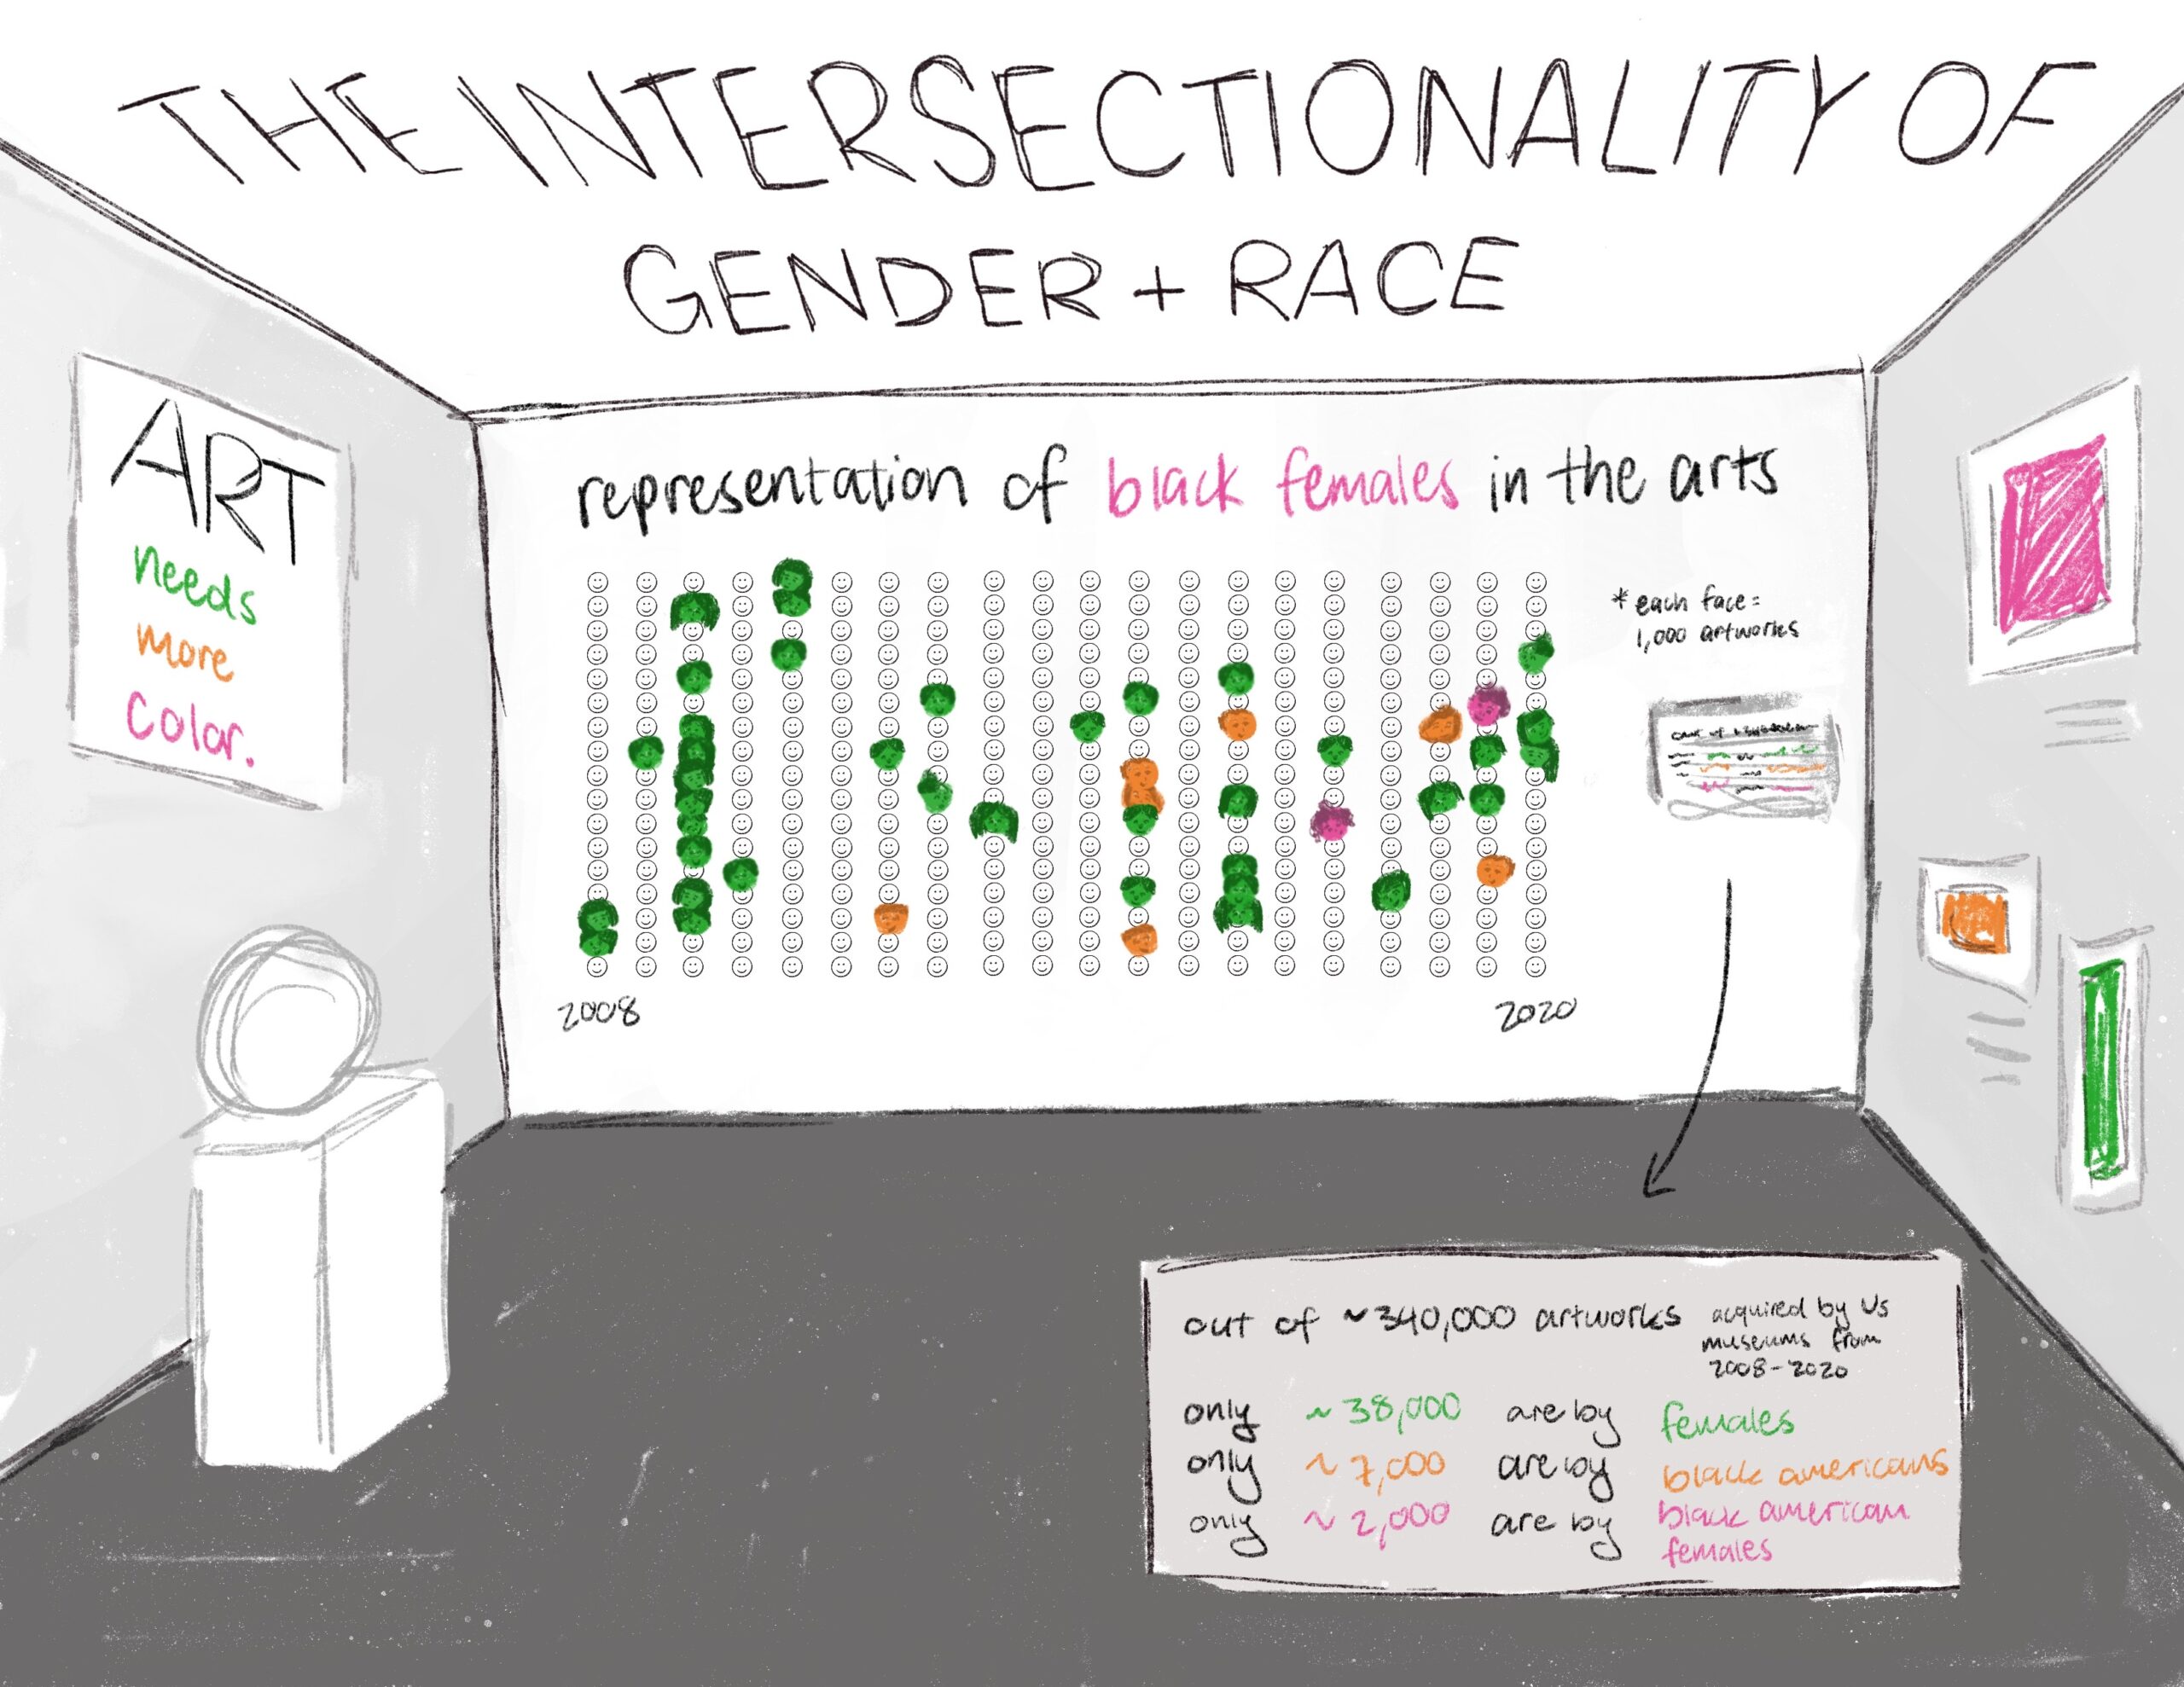
Rori Stanford, grade 12 Bergen County Academies, Hackensack, NJ Teacher: Scott Lang My data visualization covers the intersectionality of gender and race and specifically the lack of representation of Black women in the arts. I used data from the 2022 Burns Halperin Report. Racism and sexism still exist and individuals who experience both are hindered...
Honorable Mention
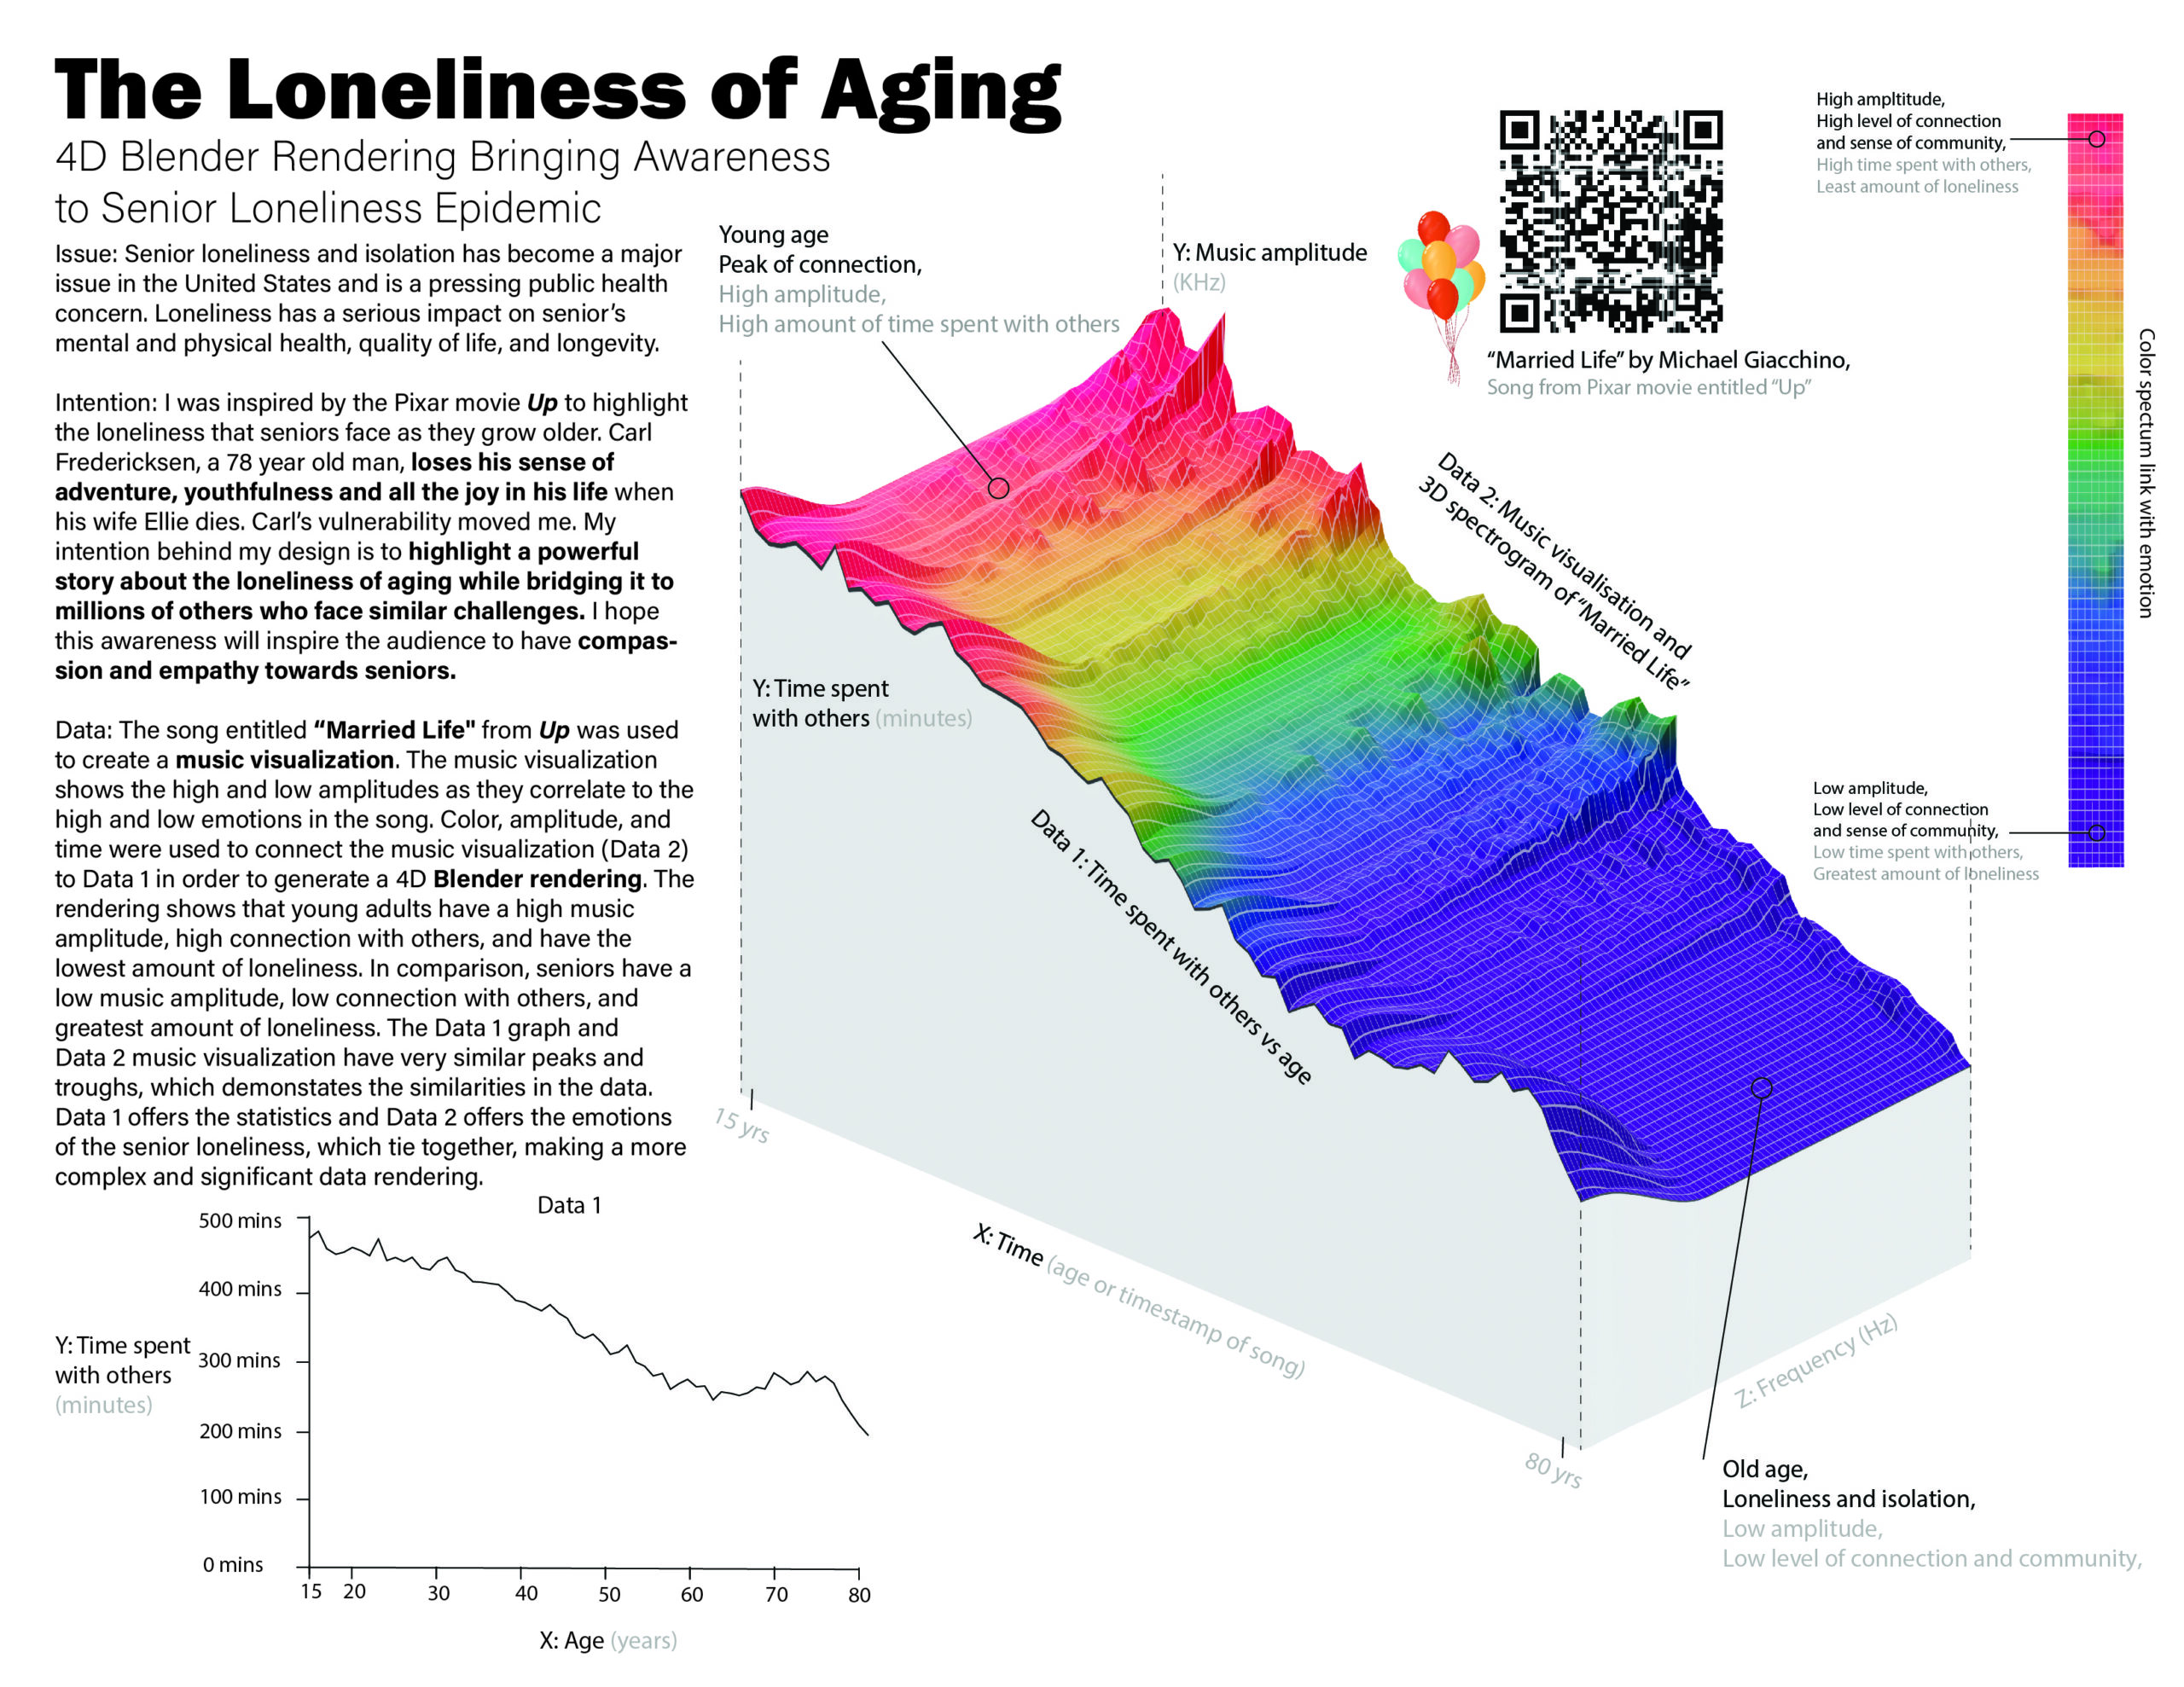
Aviya Afra, grade 11 Grauer School, Encinitas, CA My design brings awareness to the loneliness and isolation epidemic that seniors face. It highlights a story that represents millions of seniors who lack friendship and companionship. The 4D rendering is comprised of two data sets. Data 1 shows the amount of time one spends with others...
Honorable Mention
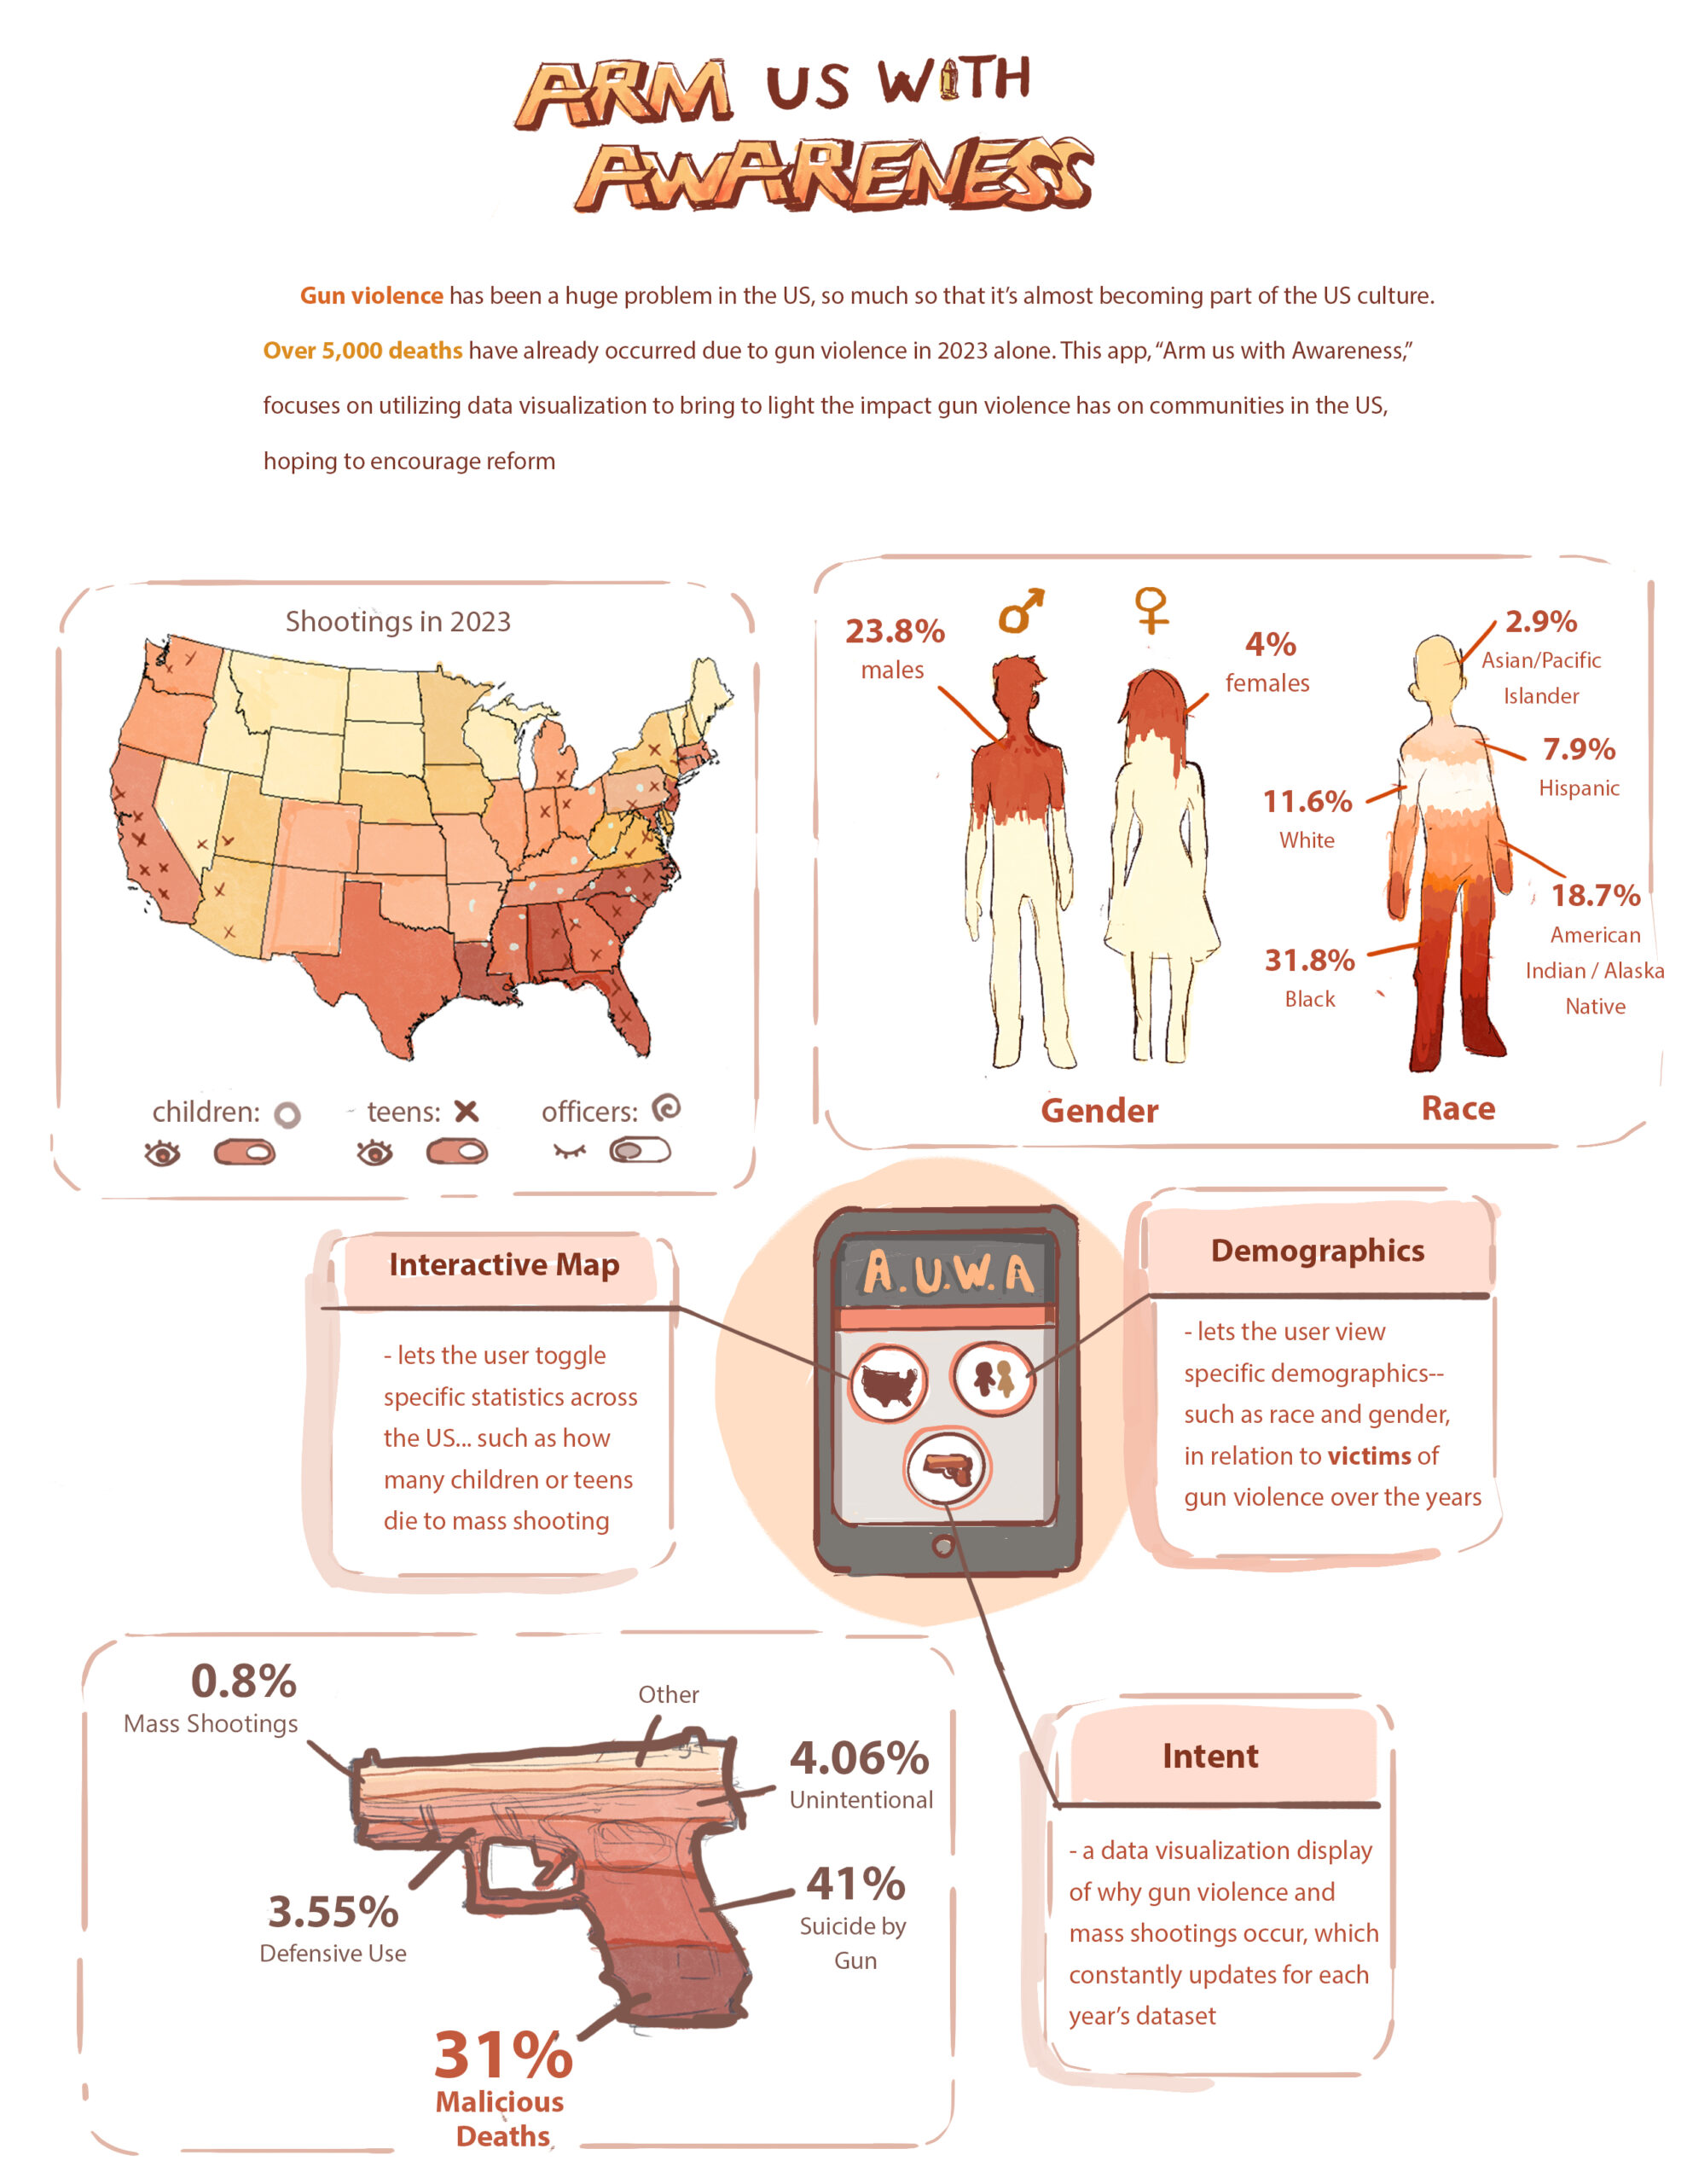
Sarah Basil, grade 12 Bergen County Academies, Hackensack, NJ Teacher: Scott Lang Gun violence is becoming more common. Anyone could fall victim to having their lives cut short by these tragic incidents. My design is an app called “Arm Us With Awareness” that addresses gun violence in the United States. It highlights important statistics, such...
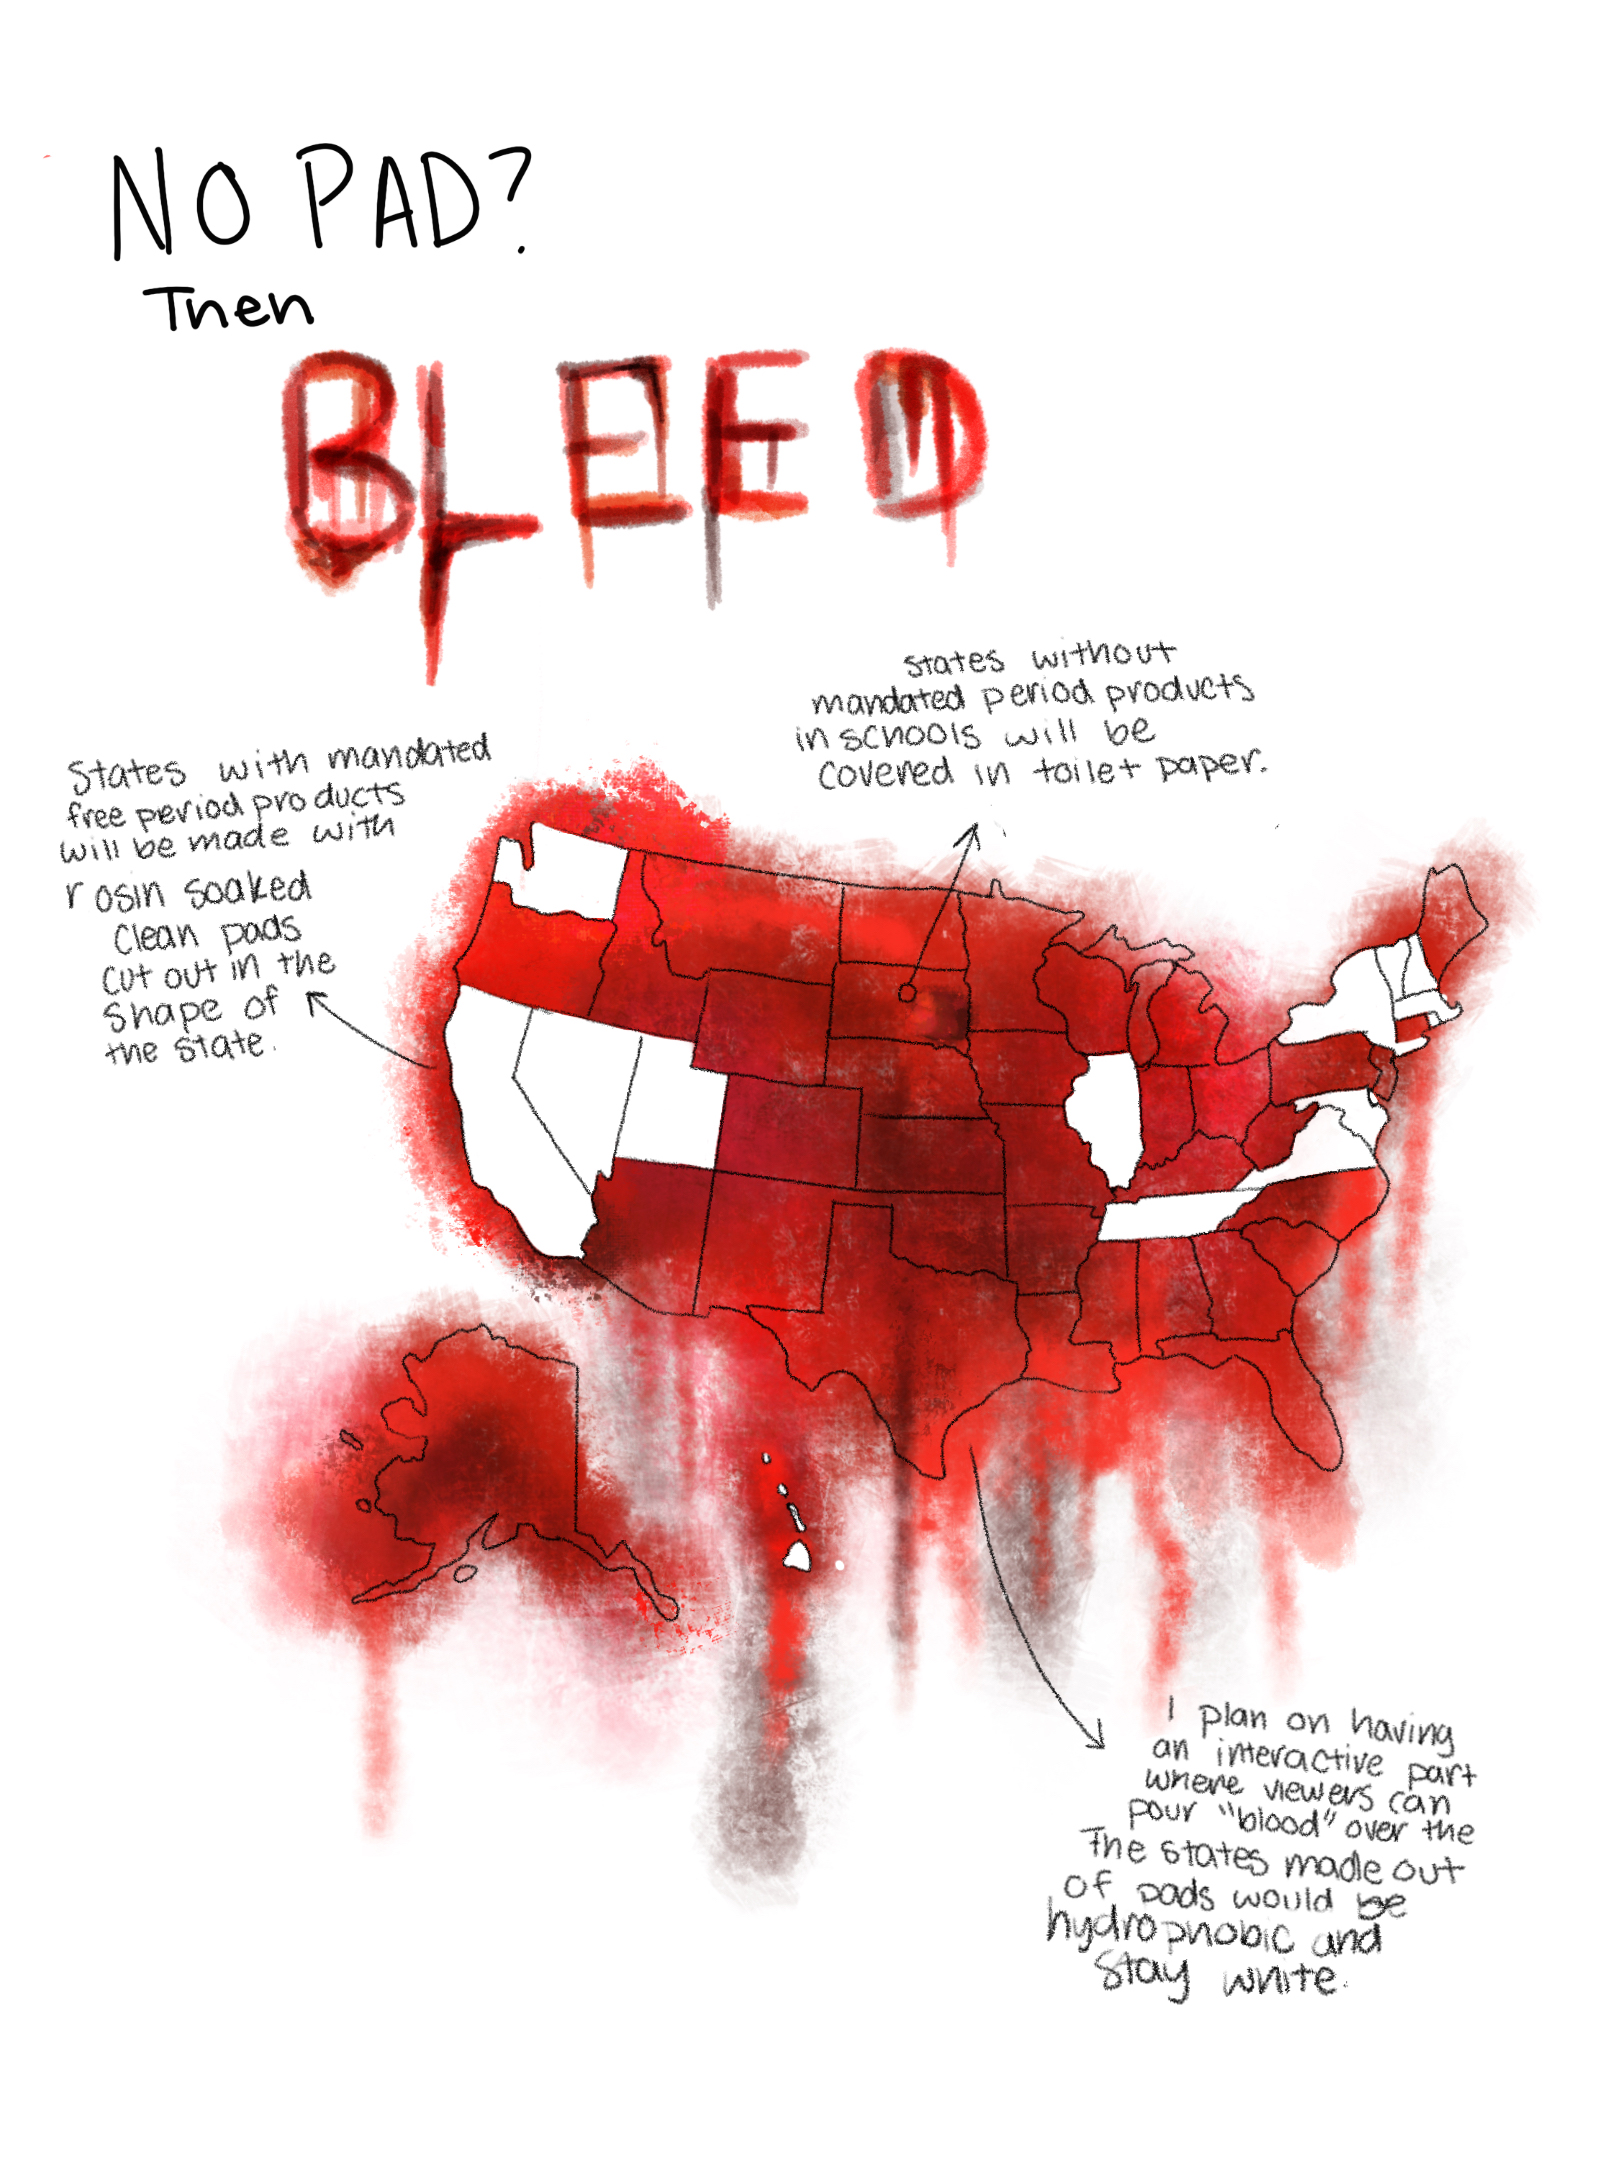
My design shows which states have mandated free menstrual products in schools. A study found that 80% of menstruating teens said they have missed class time because they did not have access to period products. One’s education should not be interrupted because there is no access to necessary health products. I found the data I used from the Alliance for Period Supplies. Data can also be gathered from each state’s legislation. I created a design that was visually striking to catch the attention of viewers. I did this by recreating a shocking material in my work: blood. An important part of my design is that the blood looks realistic and striking, while still normalizing period blood. Period poverty is a global issue that everyone, regardless of whether they menstruate, should care about. Non-menstruators do not face issues like these every day, so it is my goal to bring this issue to everyone. To do this I will display my piece in communal places.
Honorable Mention
Vera Giraudo, grade 10 Avenues The World School, New York, NY Teacher: Gretel Schwartzott My design shows which states have mandated free menstrual products in schools. A study found that 80% of menstruating teens said they have missed class time because they did not have access to period products. One’s education should not be interrupted...
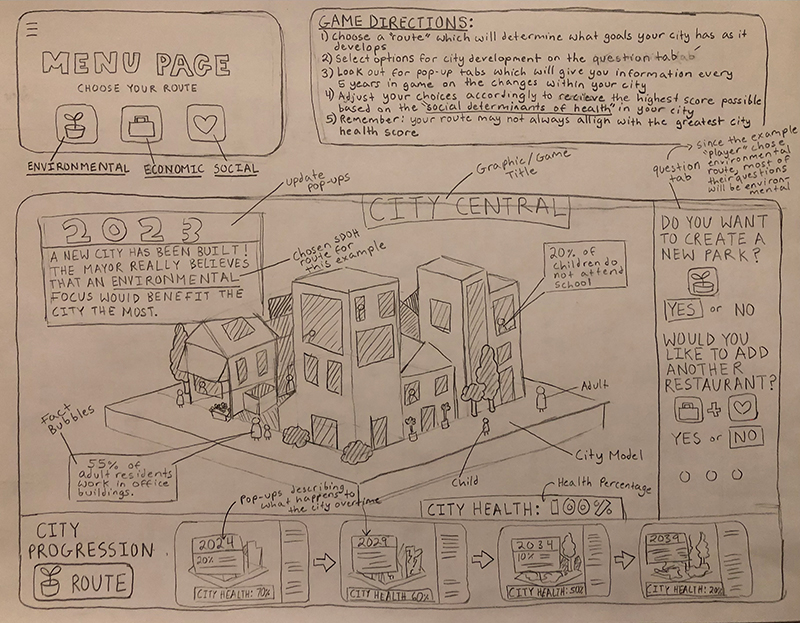
We are presenting data on social determinants of health (SDOH)— economic stability, physical environment, education, food access, community, and health care—in the context of a single city, over five decades. We will show audiences the impact of SDOH in a community. SDOH affect the conditions of every citizen with different outcomes and risks based on which SDOH are prioritized. We are primarily using data from the Office of Disease Prevention and Health Promotion at the U.S. Department of Health and Human Services, the World Health Organization, and the Centers for Disease Control and Prevention. The game layout of City Central allows players to act as a supervisor of city development and choose which SDOH to prioritize. The game layout will include a street view and map. An inventory will show what institutions are established. Pop-ups will show the city’s score based on SDOH metrics every five years. City Central will be an easily available online game with single and multiplayer options. Our design would educate audiences in an accessible way about the impacts SDOH have on even small communities. It shows local and national audiences how non-medical factors impact the health of individuals and communities and should be valued.
Honorable Mention
Grace Guo, grade 11, and Jane Martens, grade 11 Carmel High School, Carmel, IN We are presenting data on social determinants of health (SDOH)— economic stability, physical environment, education, food access, community, and health care—in the context of a single city, over five decades. We will show audiences the impact of SDOH in a community....
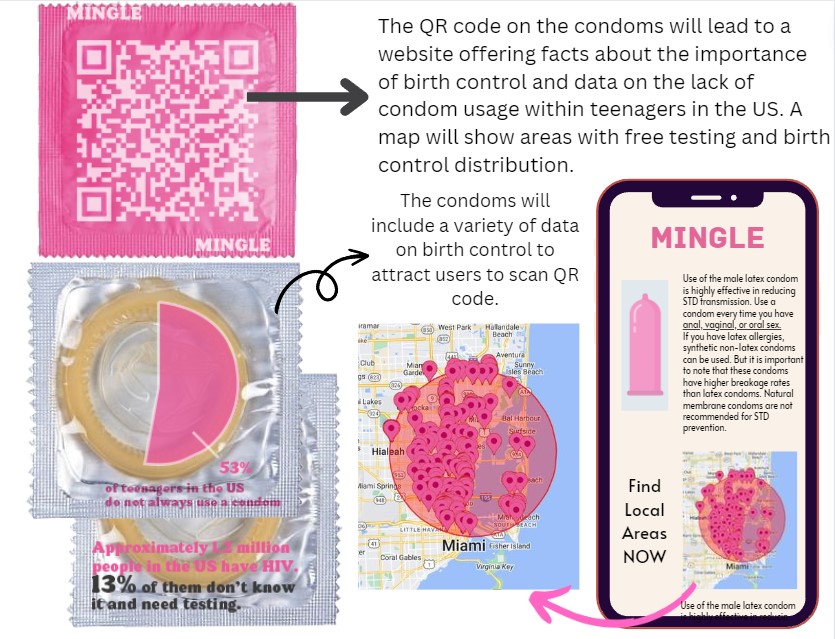
I am presenting data on the lack of condom usage and other birth control by students. I want to show students why birth control is so important by discussing the impacts of not using condoms, regardless of sexual orientation. This will help teenagers who lack proper sexual education. I found my data from news articles discussing how teenage birth control usage has dropped in recent years. I also looked at official government websites, such as the Centers for Disease Control and Prevention and the World Health Organization, that explain the importance of birth control. My design will include a pie chart on the packaging of condoms to show the consequences when they are not always used. This will entice students to scan the QR on the other side. It will share data and raise awareness that lack of condom usage can lead to an increase in STDs and pregnancy. A map will show locations offering birth control and testing. These condoms would be distributed to local high schools. The map can be expanded to other counties and states.
Honorable Mention
Amelia Kiefer, grade 12 Design and Architecture Senior High, Miami, FL Teacher: Eric Hankin I am presenting data on the lack of condom usage and other birth control by students. I want to show students why birth control is so important by discussing the impacts of not using condoms, regardless of sexual orientation. This will...
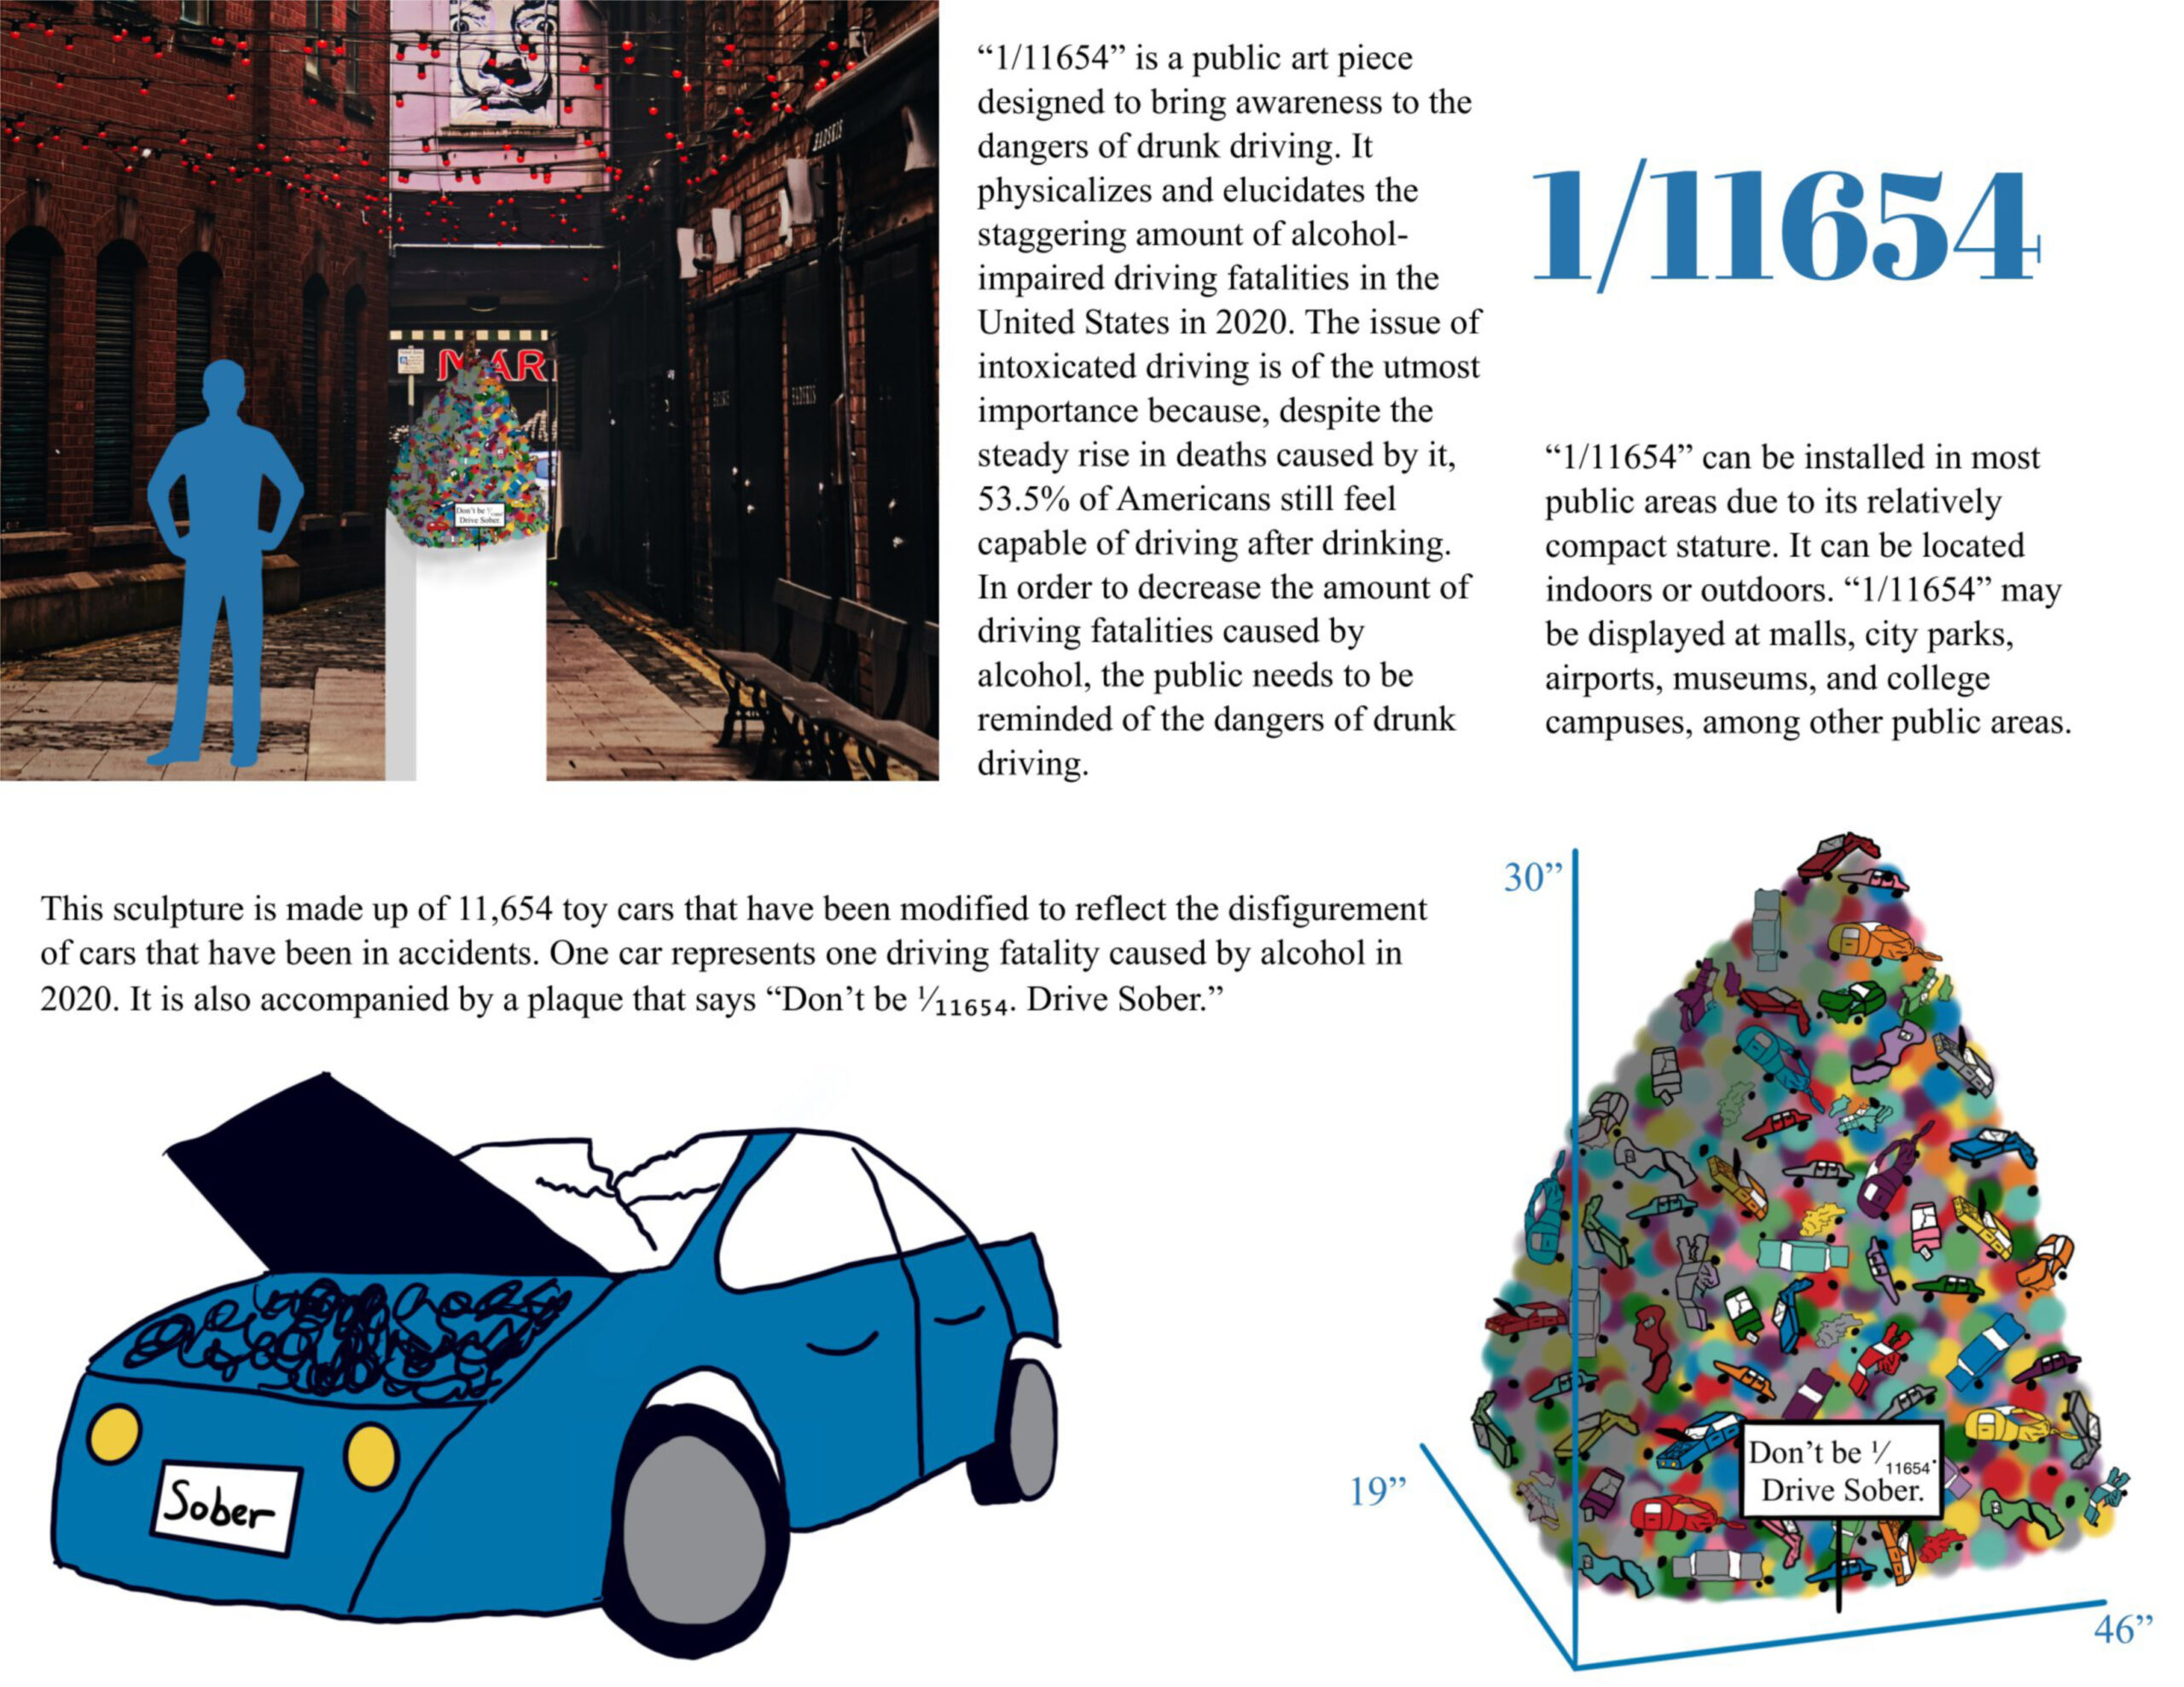
Honorable Mention
Tiffany Kurniawan, grade 9 Granada Hills Charter High School, Granada Hills, CA Teacher: Jackie Ying In 2020, 11,654 Americans died in alcohol-related driving accidents, which makes up 30% of all driving fatalities. Despite this problematic statistic, 53.5% of people believe that they are capable of driving after drinking. To decrease alcohol-impaired driving fatalities, people must...
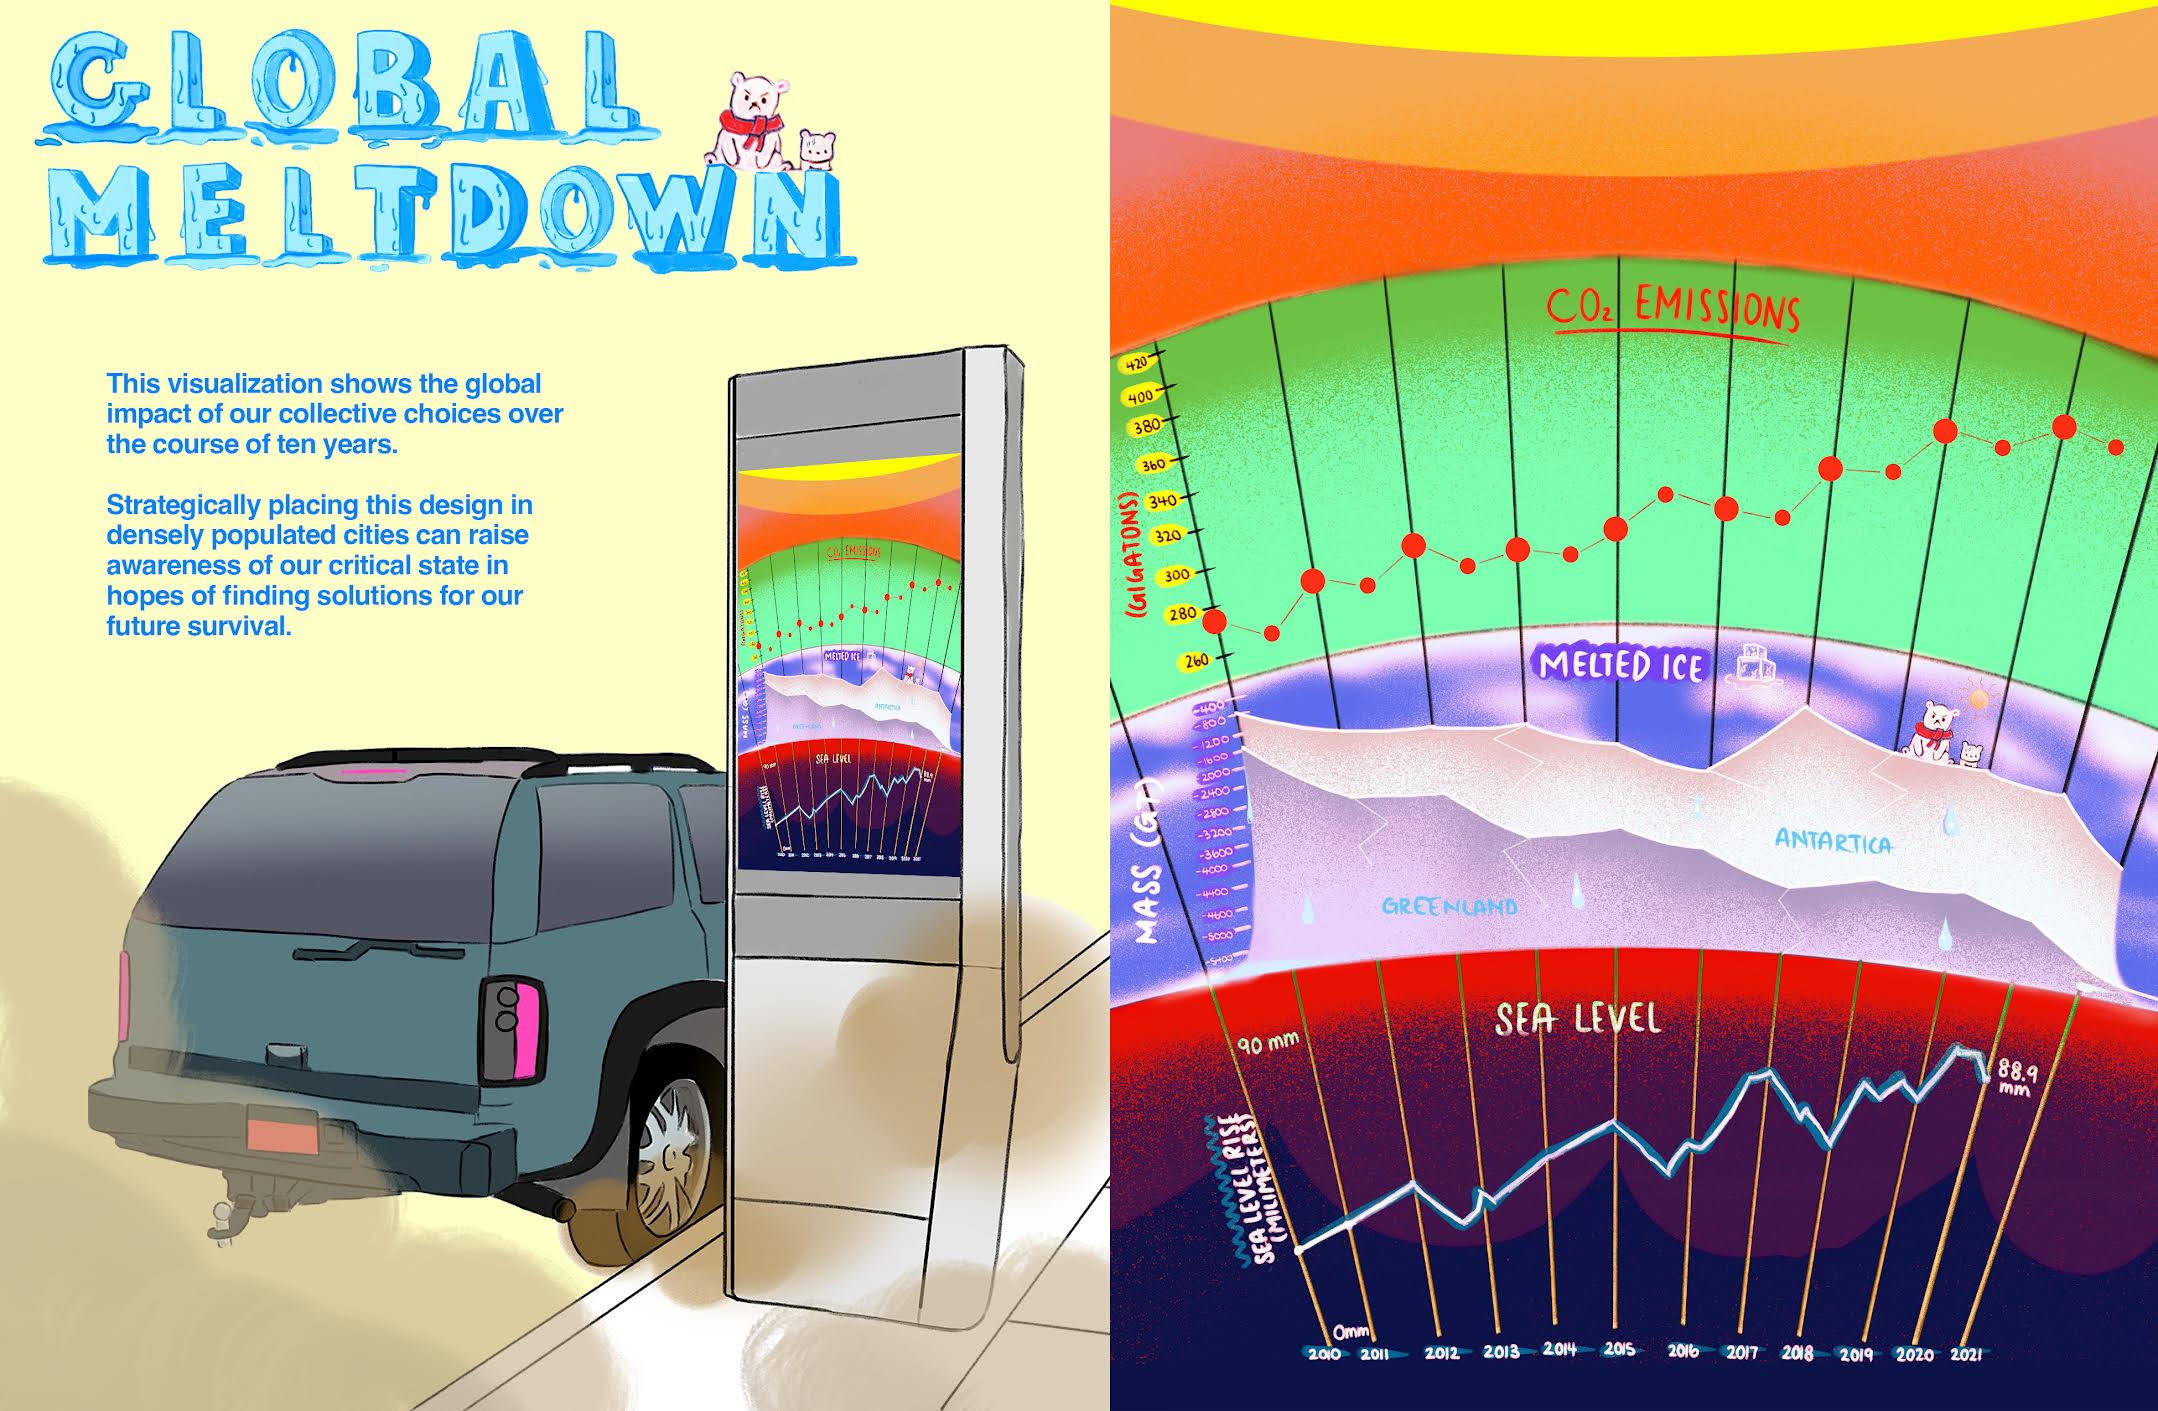
My data visualization shows the amount of CO2 emissions, glacier mass loss, and sea level changes over the past ten years. This shows the severity of climate change which affects so many forms of wildlife and our human population. My visualization can help raise urgency in reversing our collective mistakes. I researched various data sets from sources tracking CO2 emissions, glacier mass loss, and sea level changes from resources provided by NASA. My design consists of three parts: CO2 emissions, melted ice, and sea level. CO2 levels are measured in gigatons, ice mass in tons, and sea level changes in millimeters. All graphs are split into the years symbolizing the planetary scale changes over time. This design will be displayed on parking kiosks in busy cities where air pollution is severe. The visualization will make people more aware of the global impact of our choices and inspire them to find alternative energy sources and solutions.
Honorable Mention
Jaime Lai, grade 11 Dwight-Englewood School, Englewood, NJ My data visualization shows the amount of CO2 emissions, glacier mass loss, and sea level changes over the past ten years. This shows the severity of climate change which affects so many forms of wildlife and our human population. My visualization can help raise urgency in reversing...