Honorable Mention
Robin Suh, grade 9
Tenafly High School, Tenafly, NJ
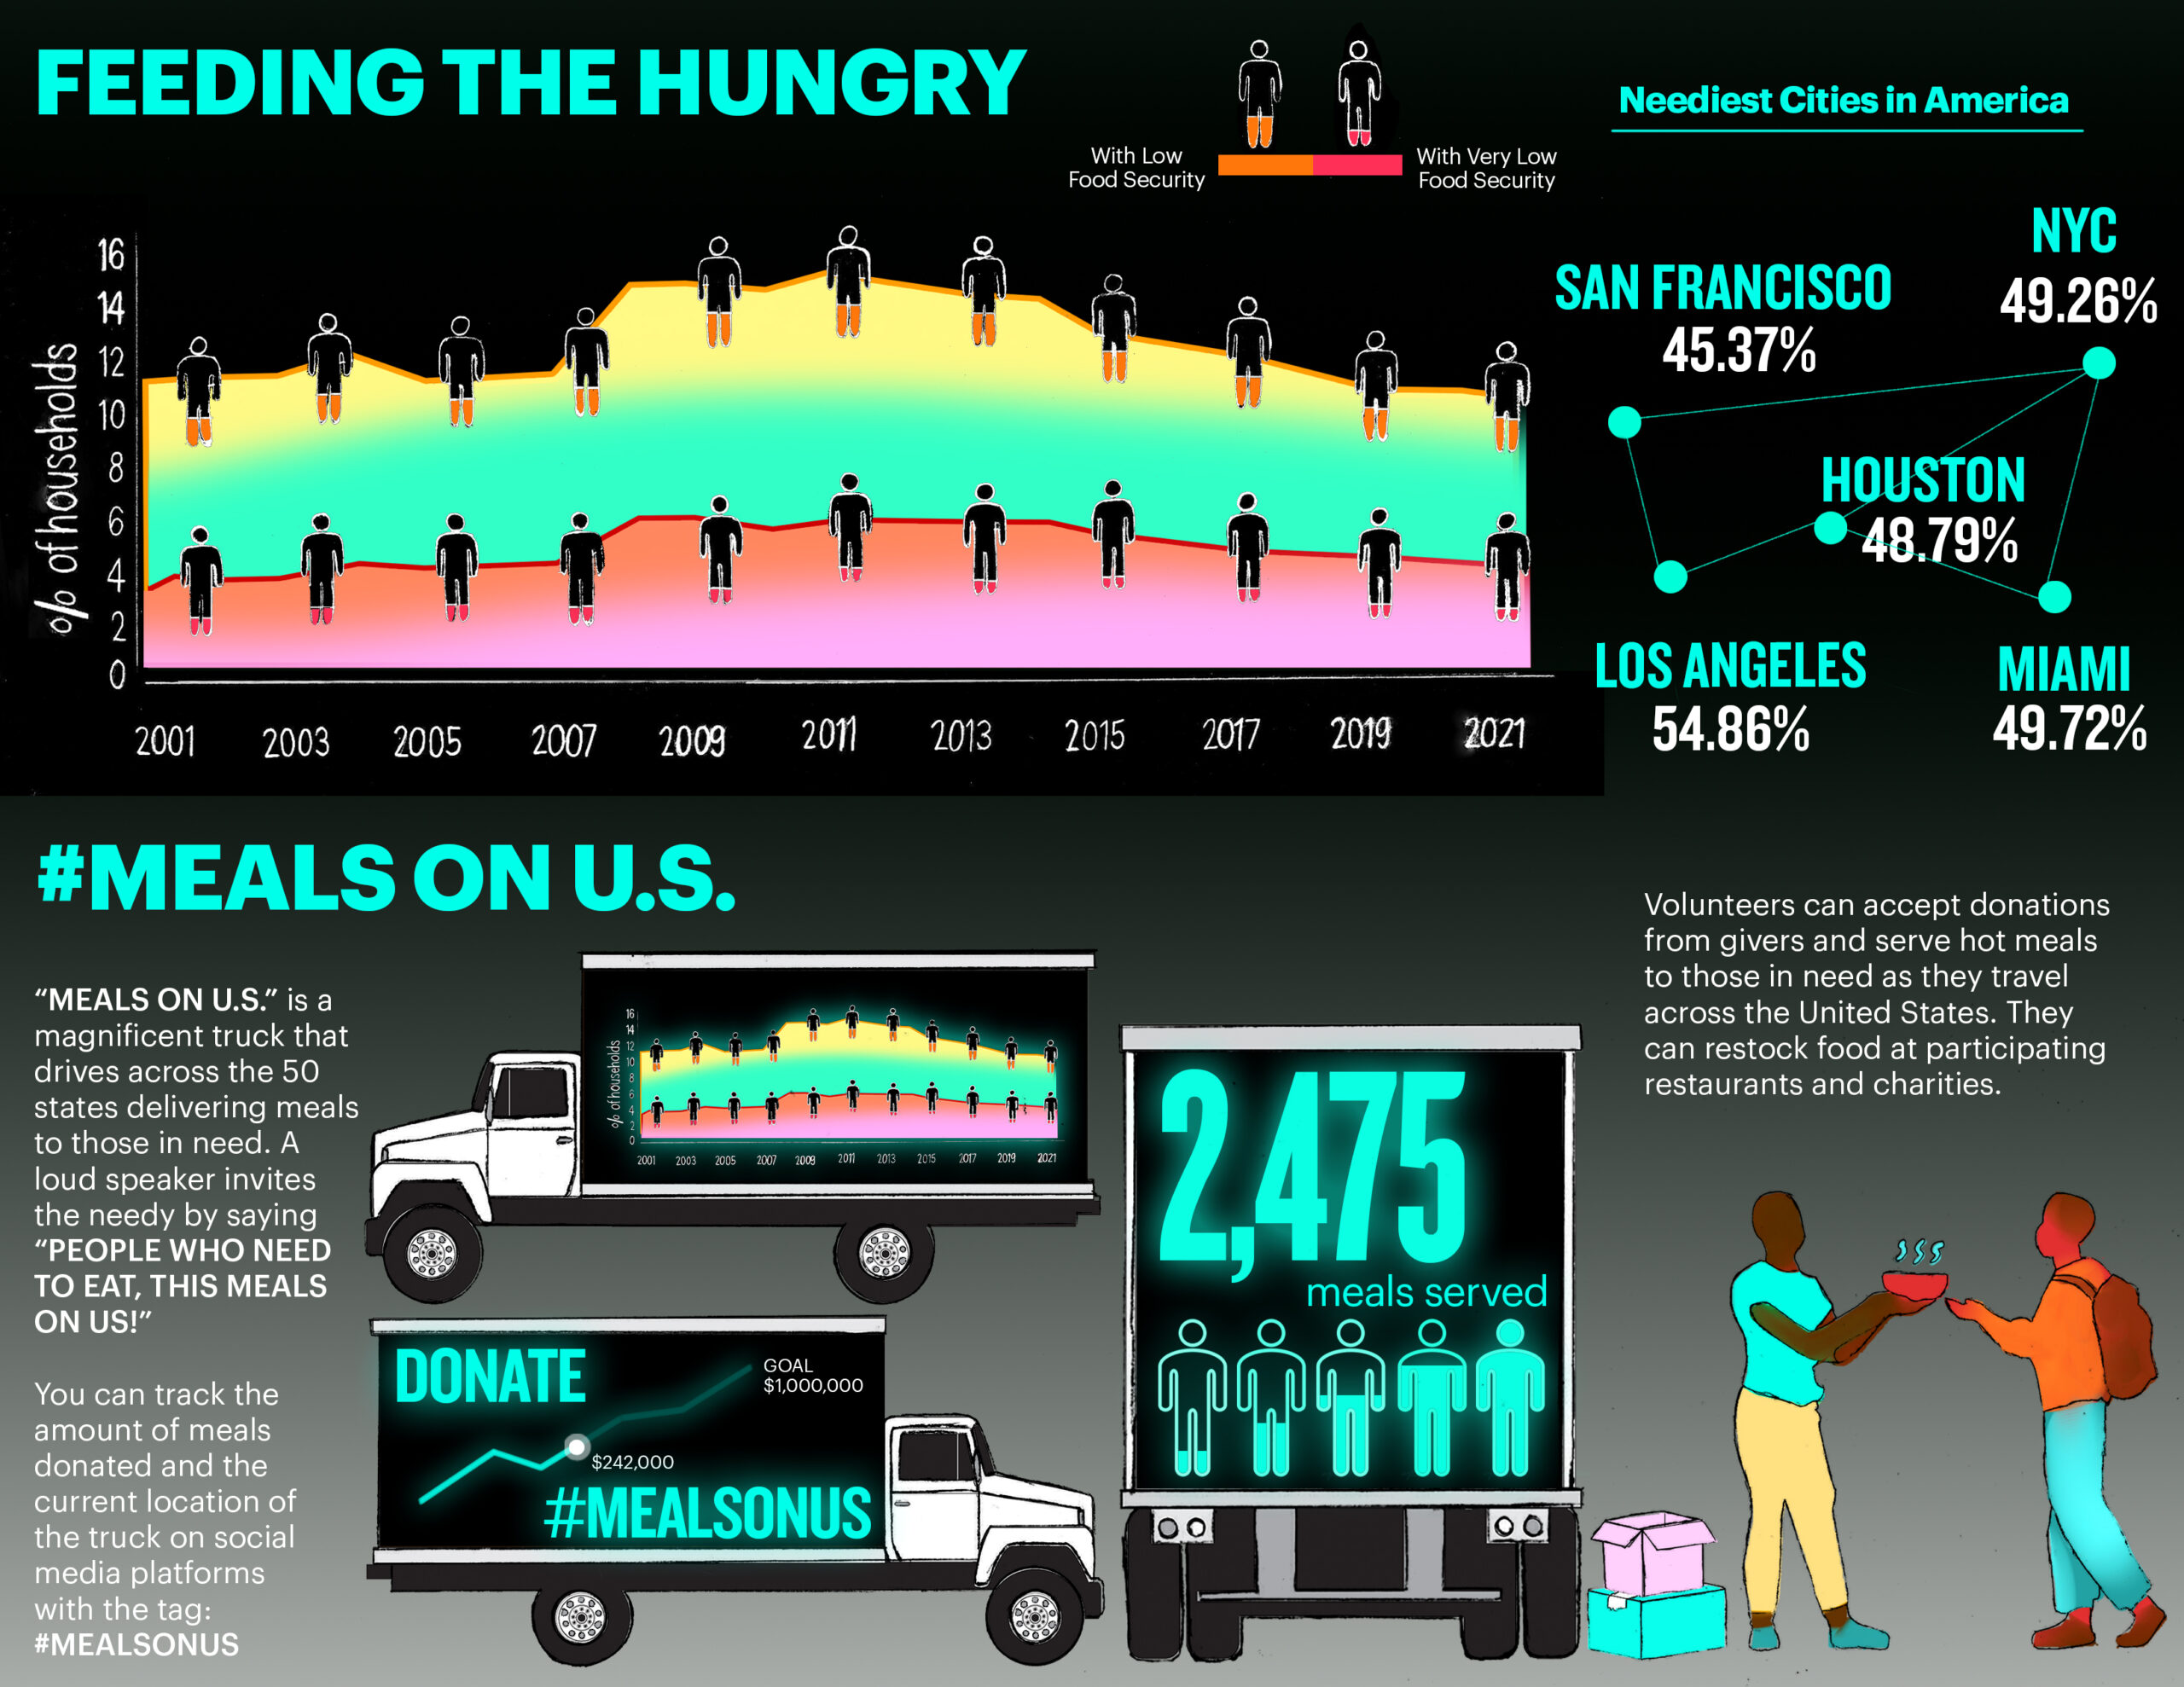
My data shows the percentage of households with low food security in the United States. This can help us understand the needs of others and provide a way to donate through a trackable food truck. I want to impact donors and recipients by providing awareness and methods to help. My main data is from a USDA Economic Research Service report on household food security. I also researched cities with the highest need to highlight the most critical areas in our country. My main graph shows the percentage of households with low and very low food security in the past 10 years. The figures representing the points on the chart are shown as orange and red empty human symbols indicating their critical condition. My design is displayed as LED screens on a traveling donation truck. The screens also show how many meals are delivered through my campaign called #MealsonUS. Users can track this information and the location of the truck through social media updates. This will encourage involvement in donating across the country.