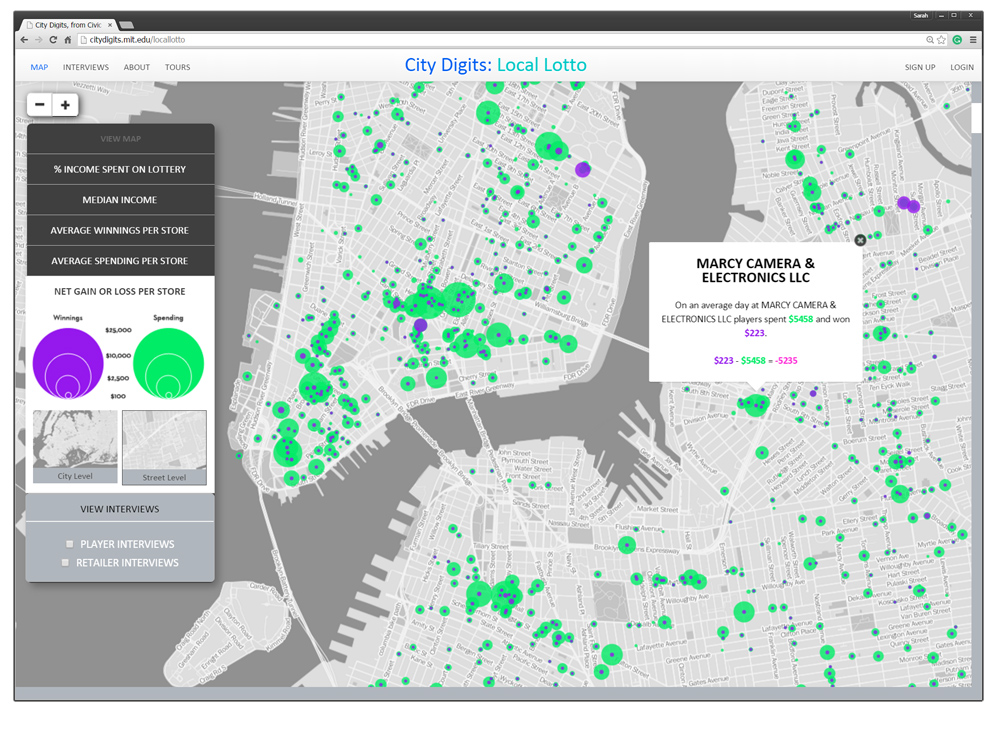
Maps show the disparity between lottery spending and winnings for specific Lotto vendors as net gains and losses per store.
In 2012, math professor Laurie Rubel developed, with support from the National Science Foundation, the City Digits project to help high school students learn math by examining urban injustices in their own New York City neighborhood. Partnering with civic designer Sarah Williams, the team designed a set of place-based learning tools to integrate richer data analysis for the students. Their work is featured in the exhibition By the People: Designing a Better America, curated by Cynthia Smith, Curator of Socially Responsible Design at Cooper Hewitt.
Cynthia Smith (CS): The City Digits project pilots and tests curriculum and Web-based tools to help high school students understand mathematics by exploring social justice issues. Where did the initial concept for City Digits come from? Why did you focus on the urban context?
Laurie Rubel (LR): I have been working on integrating mathematics and social justice for about twenty years, in my work with New York City teachers while at CUNY and in my own teaching of mathematics. I was looking for extramural funding to create resources and tools for mathematics teachers in New York City to be able to draw upon. I envisioned possibilities of marrying mathematics and social justice with new mapping technologies, to integrate richer data analysis and advocacy opportunities for youth. In my searching for potential collaborators, I got connected to Sarah and her work.
Sarah Williams (SW): Laurie Rubel contacted my research lab (Civic Data Design Lab) as well as the Center for Urban Pedagogy about engaging in a project with her that would focus on developing geospatial visualizations tools that would teach math using place-based social justice issues as the framework. Together, the team drafted a proposal for what became City Digits. I was excited about the collaboration, as the goals of the project aligned with my research, which focuses on using data visualizations to communicate policy issues to broad groups beyond the policy arena.
CS: What social-justice and equity issues have students been able to explore with the Local Lotto? What practical learning skills did the students acquire?
LR: To understand how the lottery works, as a system, one needs to understand the mathematics of the games. Students had the opportunity to build conceptual understanding of the combinatorical structure of the lottery games. They use mathematics and quickly see how enormous the number of possible combinations becomes, and how minute anyone’s chances of winning are.
SW: Beyond the math skills, students also learned how the New York State lottery is run and how it affects their community. For example, the students learned that some studies call the lottery a regressive tax because it places a heavier tax burden on the poor than on the wealthy. Students use the Local Lotto maps to explore this relationship. Students also learn that funds earned from New York State lottery sales go toward education budget gaps across the state, which means funds generated from lottery sales in Brooklyn might not be directly used for education in Brooklyn. Students involved in the Local Lotto curriculum debated ways to change policies around the lottery so that the funds serve the communities in which the money is taken.
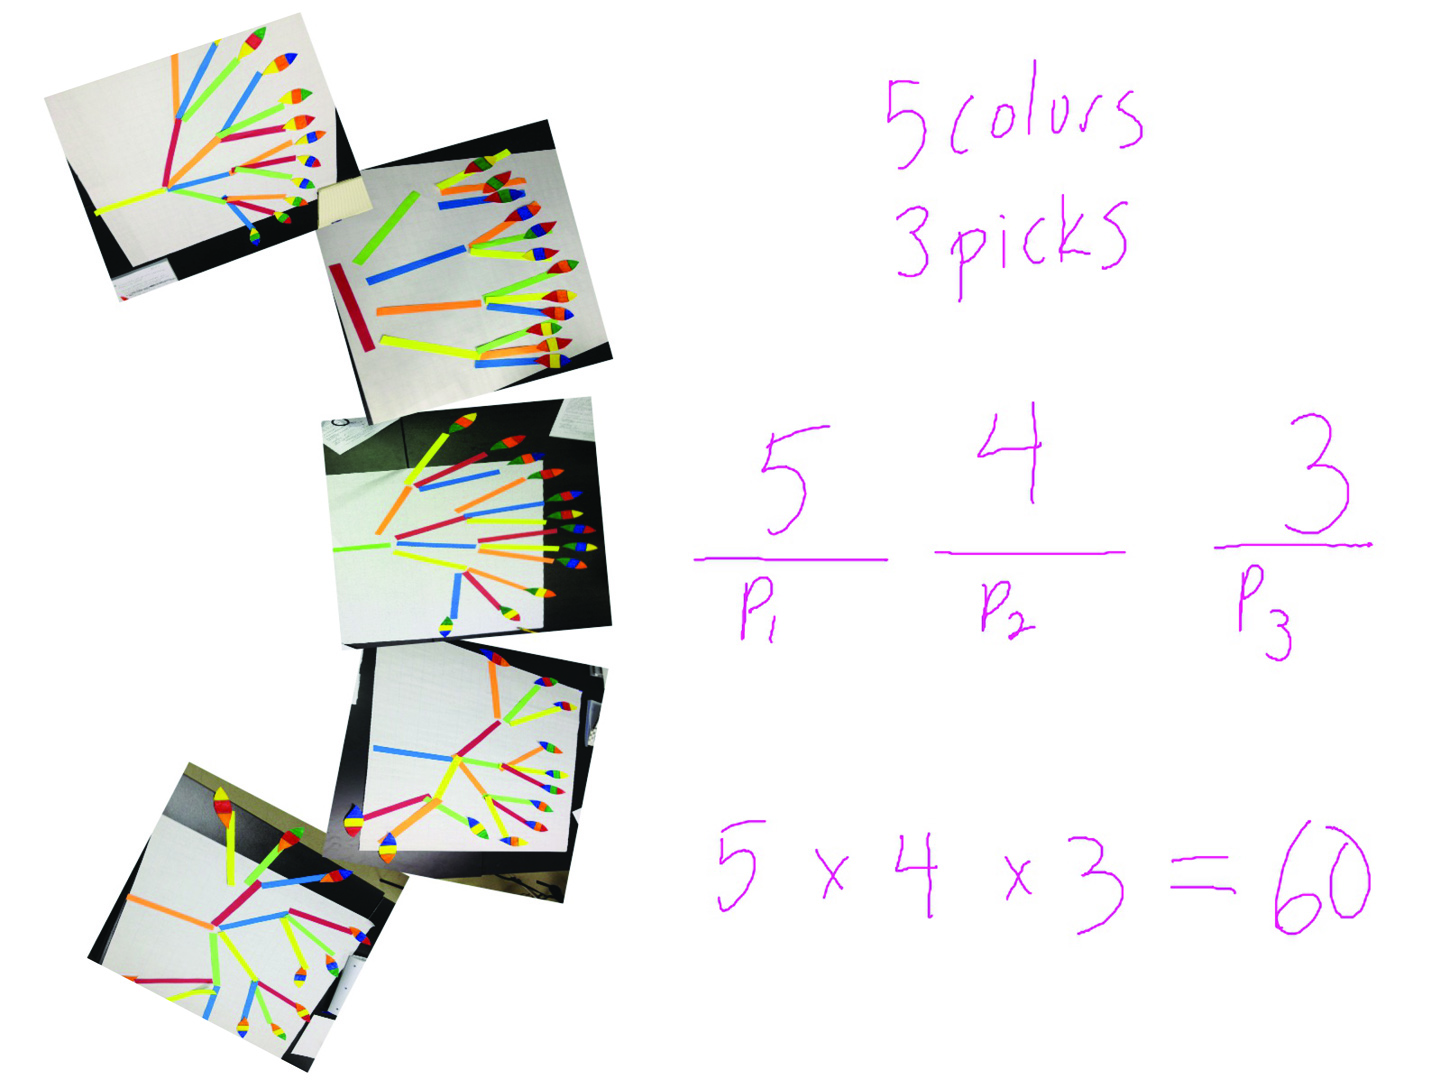
A combinatorical tree diagram and its multiplicative structure.
CS: How did design help improve the delivery of the curriculum? How did the Web-based and mobile computing tools support the learning objectives?
LR: Part of the appeal for students was that we were bringing them something tangible, something they saw all around them, something that they could use to understand their neighborhood better. The field research using the mobile tools was a highlight. Even in cold temperatures, students were highly interested in canvassing the neighborhood to learn about the lottery in situ.
SW: The design of the map helped to make visible how math works in our everyday life. One of the best examples is the street-level retailer maps, which show how much money every lottery retailer in New York City sells in winning and losing lottery tickets. The circular graphs placed on all lottery retail locations in New York City help expose that no matter where you are, the odds of winning are the same, and they are usually stacked against the players.
CS: Why was it important to include both quantitative and qualitative elements for the students’ learning? Can you provide some examples?
LR: Mathematics tells the story of how nearly impossible it is to win a jackpot game. Mathematics allows you to analyze advertising and understand what is being conveyed and what is being skipped, and why. Quantitative data shows us how many tickets are sold at each retail location. But it is only through people’s stories about hopes that they have with regards to meeting needs for their family that one gets a sense of how the lottery as a system can be seen to be preying on people with financial needs.
SW: I believe it is essential for all data scientists to ask the people which of the data describes whether the results of their analysis are credible. Analysis built with data is only as good as the data and models used to develop them, and, therefore, can hold the biases of those collecting and developing the analysis.
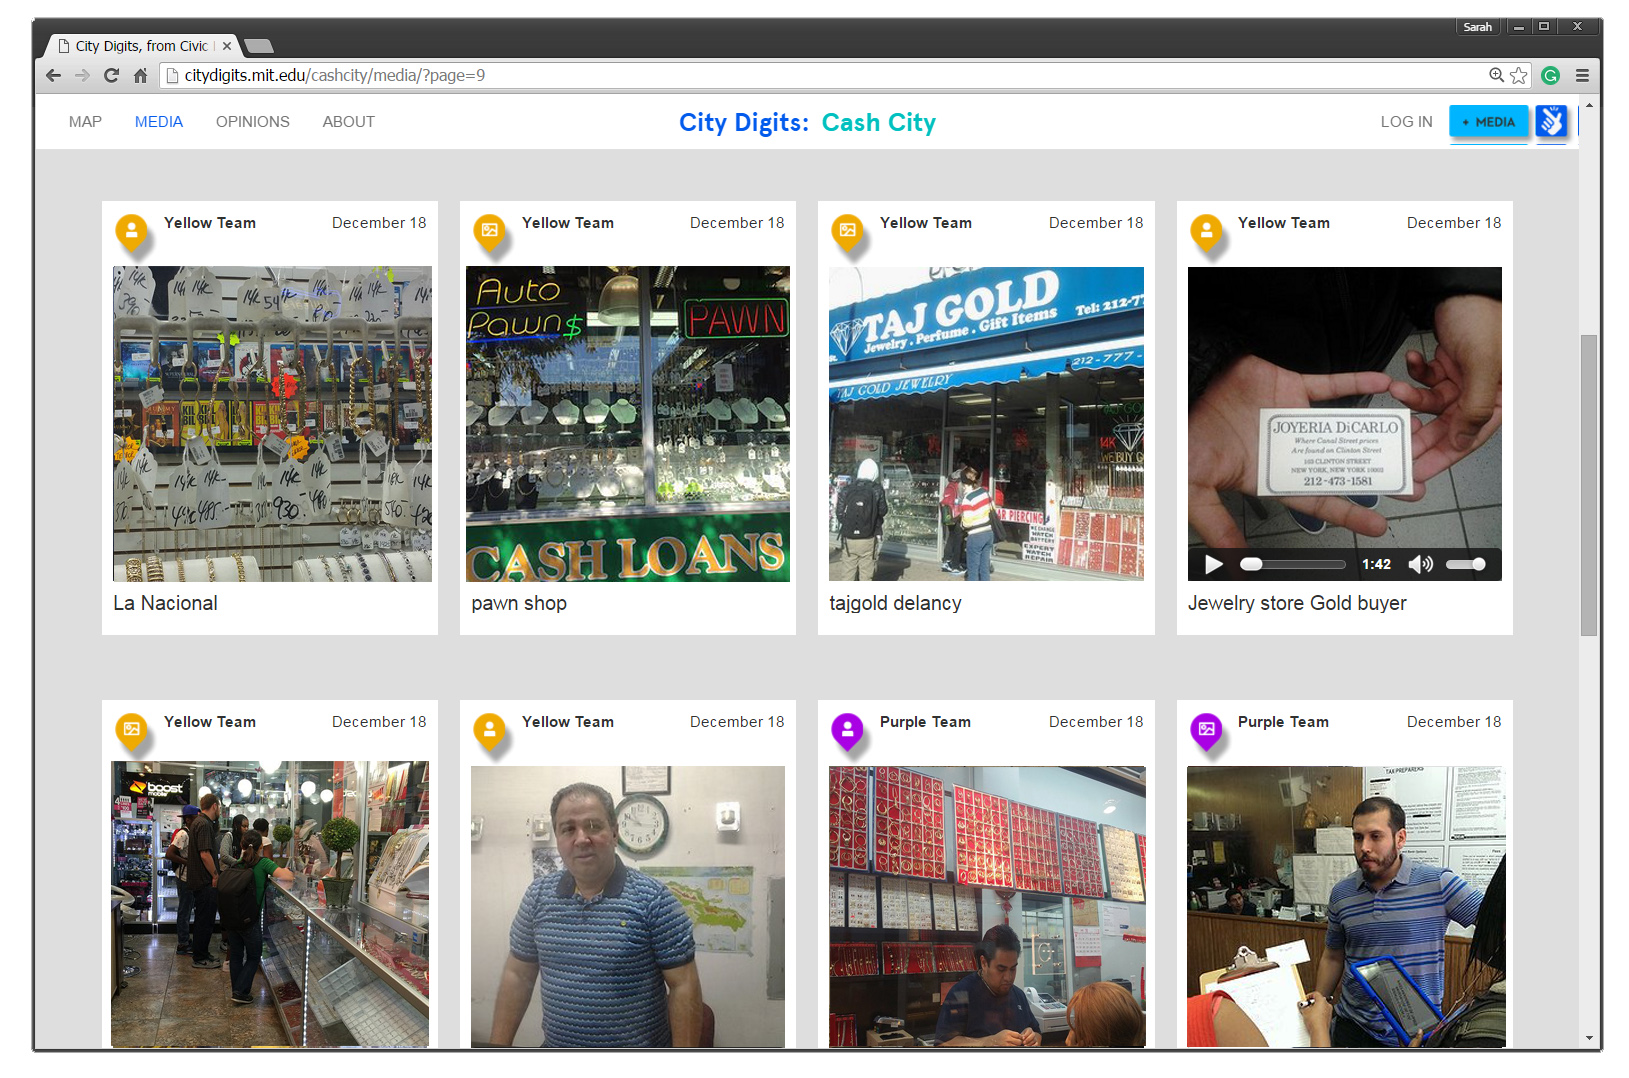
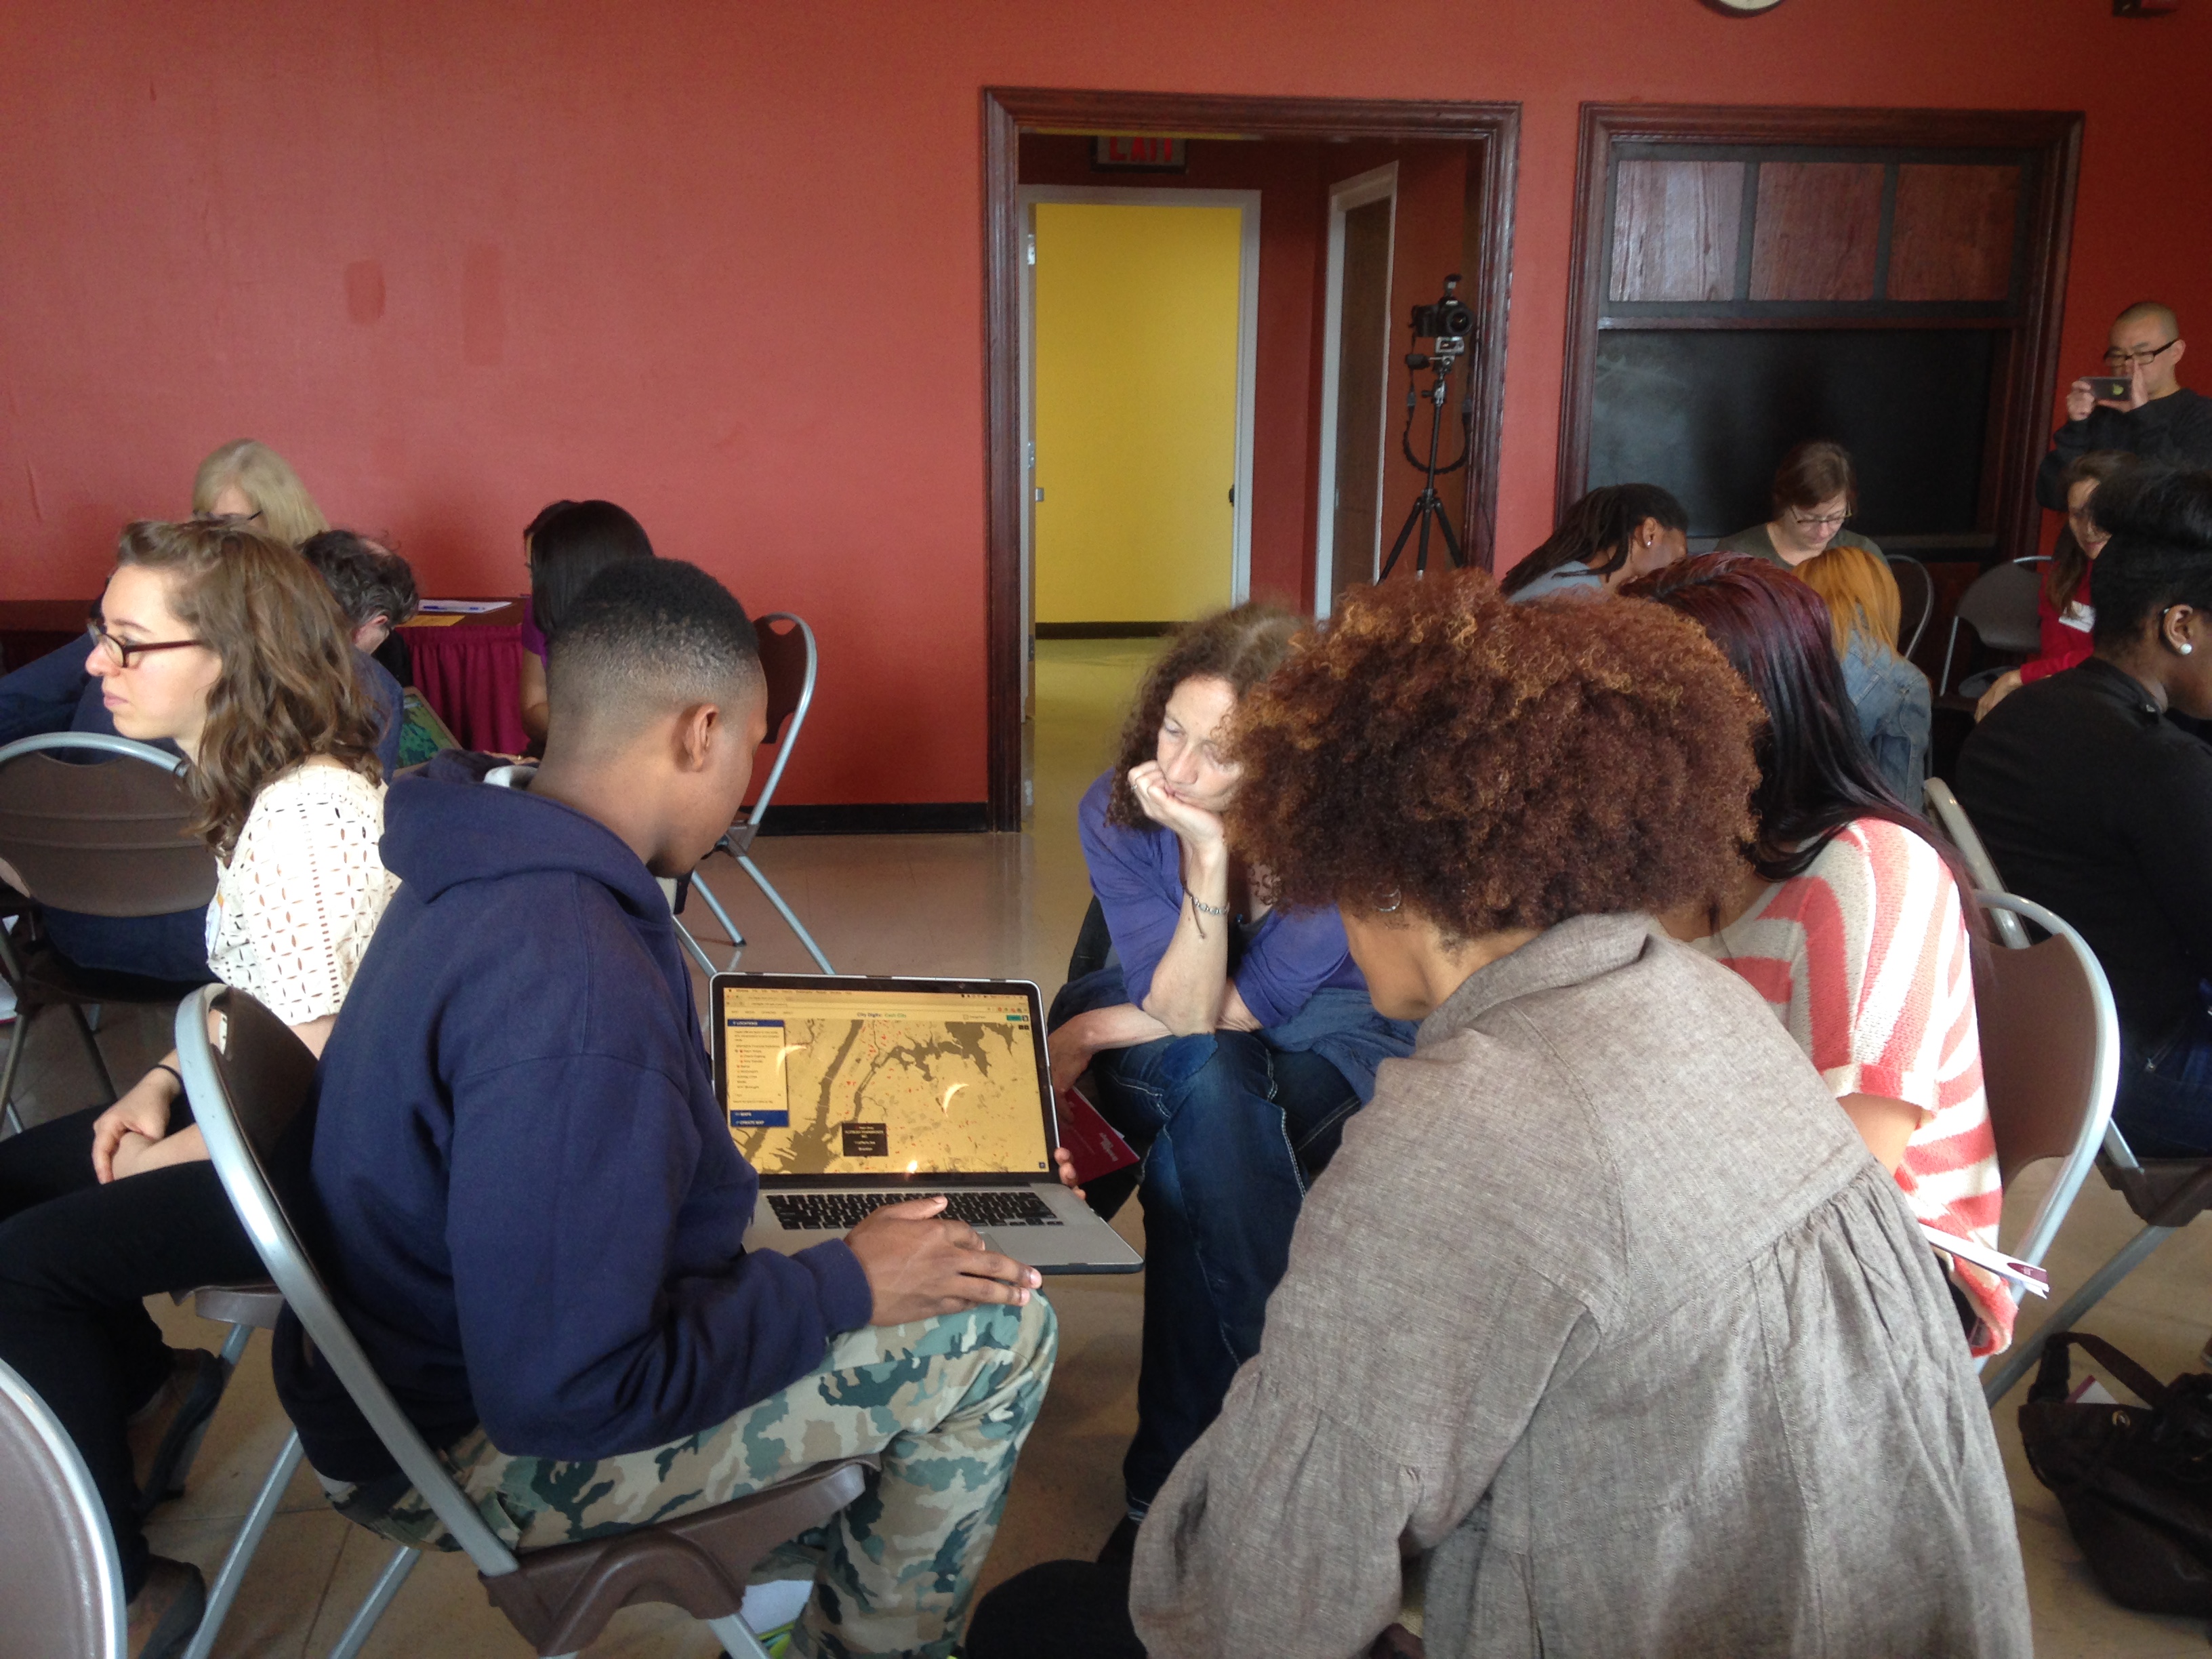
Youth use City Digits: Cash City mobile application to collect, survey, and generate multimedia stories about how nontraditional financial intuitions, such as pawnshops and check-cashing businesses, affect the communities in which they exist.
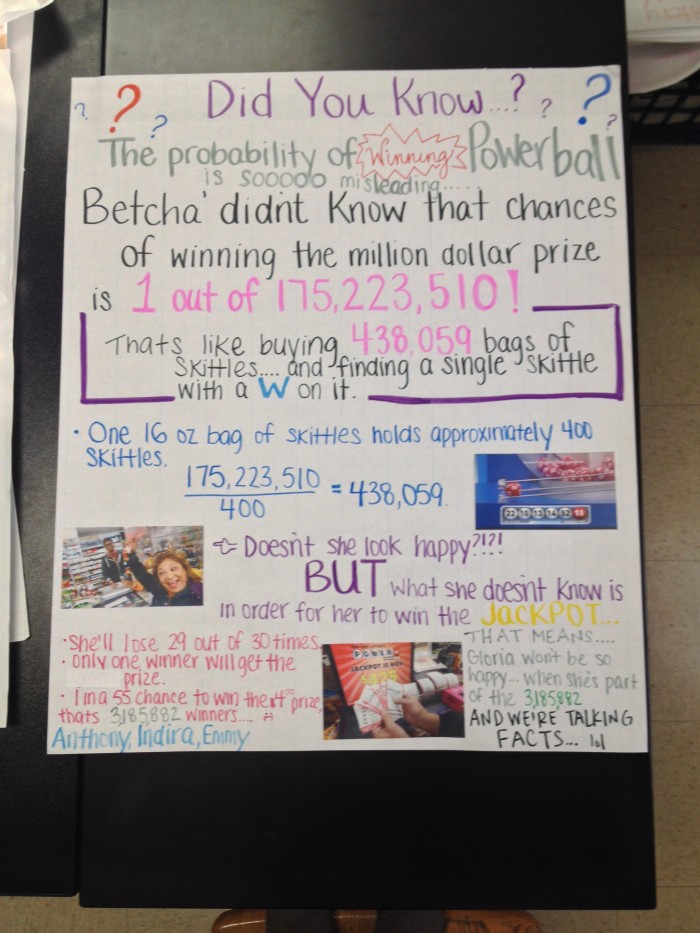
Students respond to the New York Lottery’s “Hey, You Never Know” campaign with “Hey, Now You Know,” which illustrates the probability of winning.
CS: Laurie, your work combines mathematics, social justice, and diversity. How do these subjects overlap? How did you come to this work? How does it currently manifest in your teaching and research?
LR: Early in my career, I was fortunate to be part of the Diversity in Mathematics Education (DiME) Center for Learning & Teaching, training mathematics education researchers like me to focus their work on issues of diversity and equity. I was inspired by the teachings of Rico Gutstein and focused my work on supporting teachers to “teach mathematics for social justice” in New York City high schools. This City Digits project has allowed me to explore new areas of design-based research, mapping, and technology.
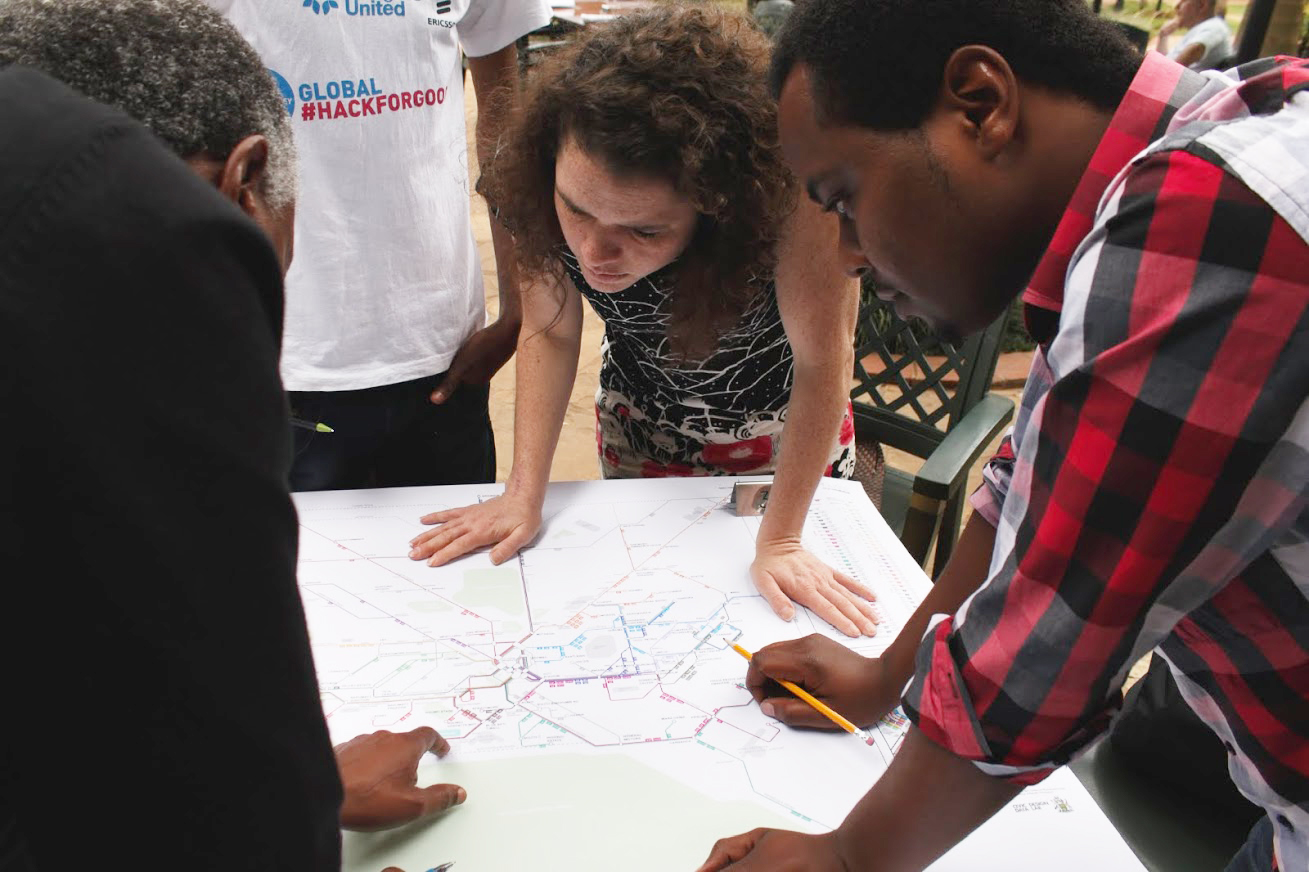
Teachers grapple with teaching mathematics for spatial justice during a summer program at Math for America.
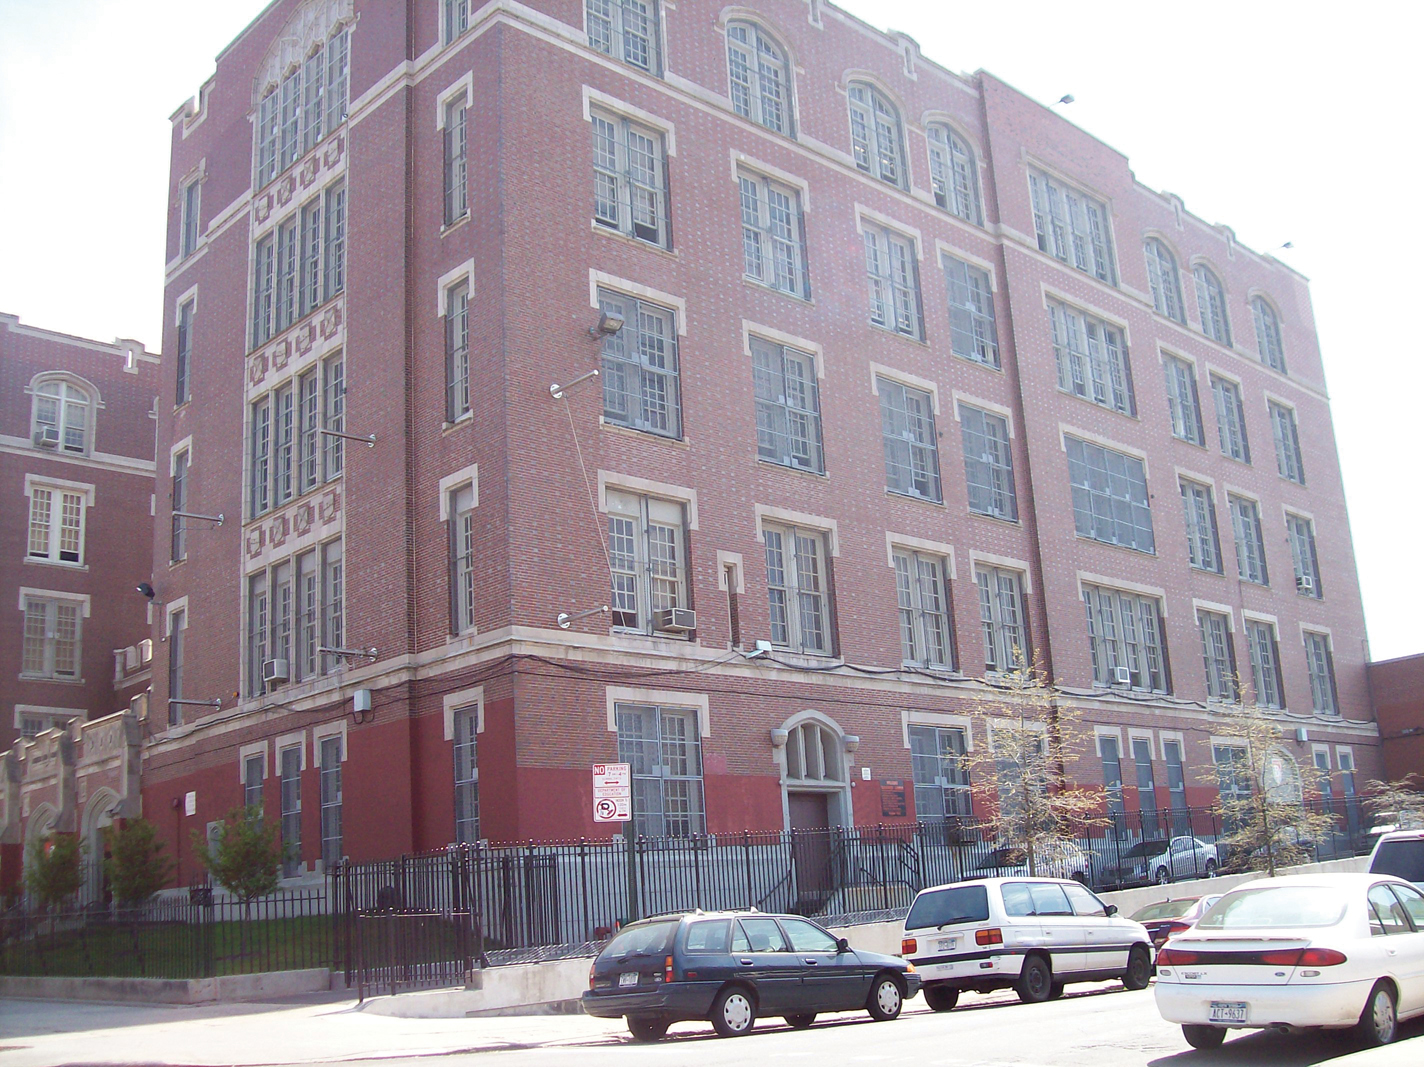
School as research site in Brooklyn, New York.
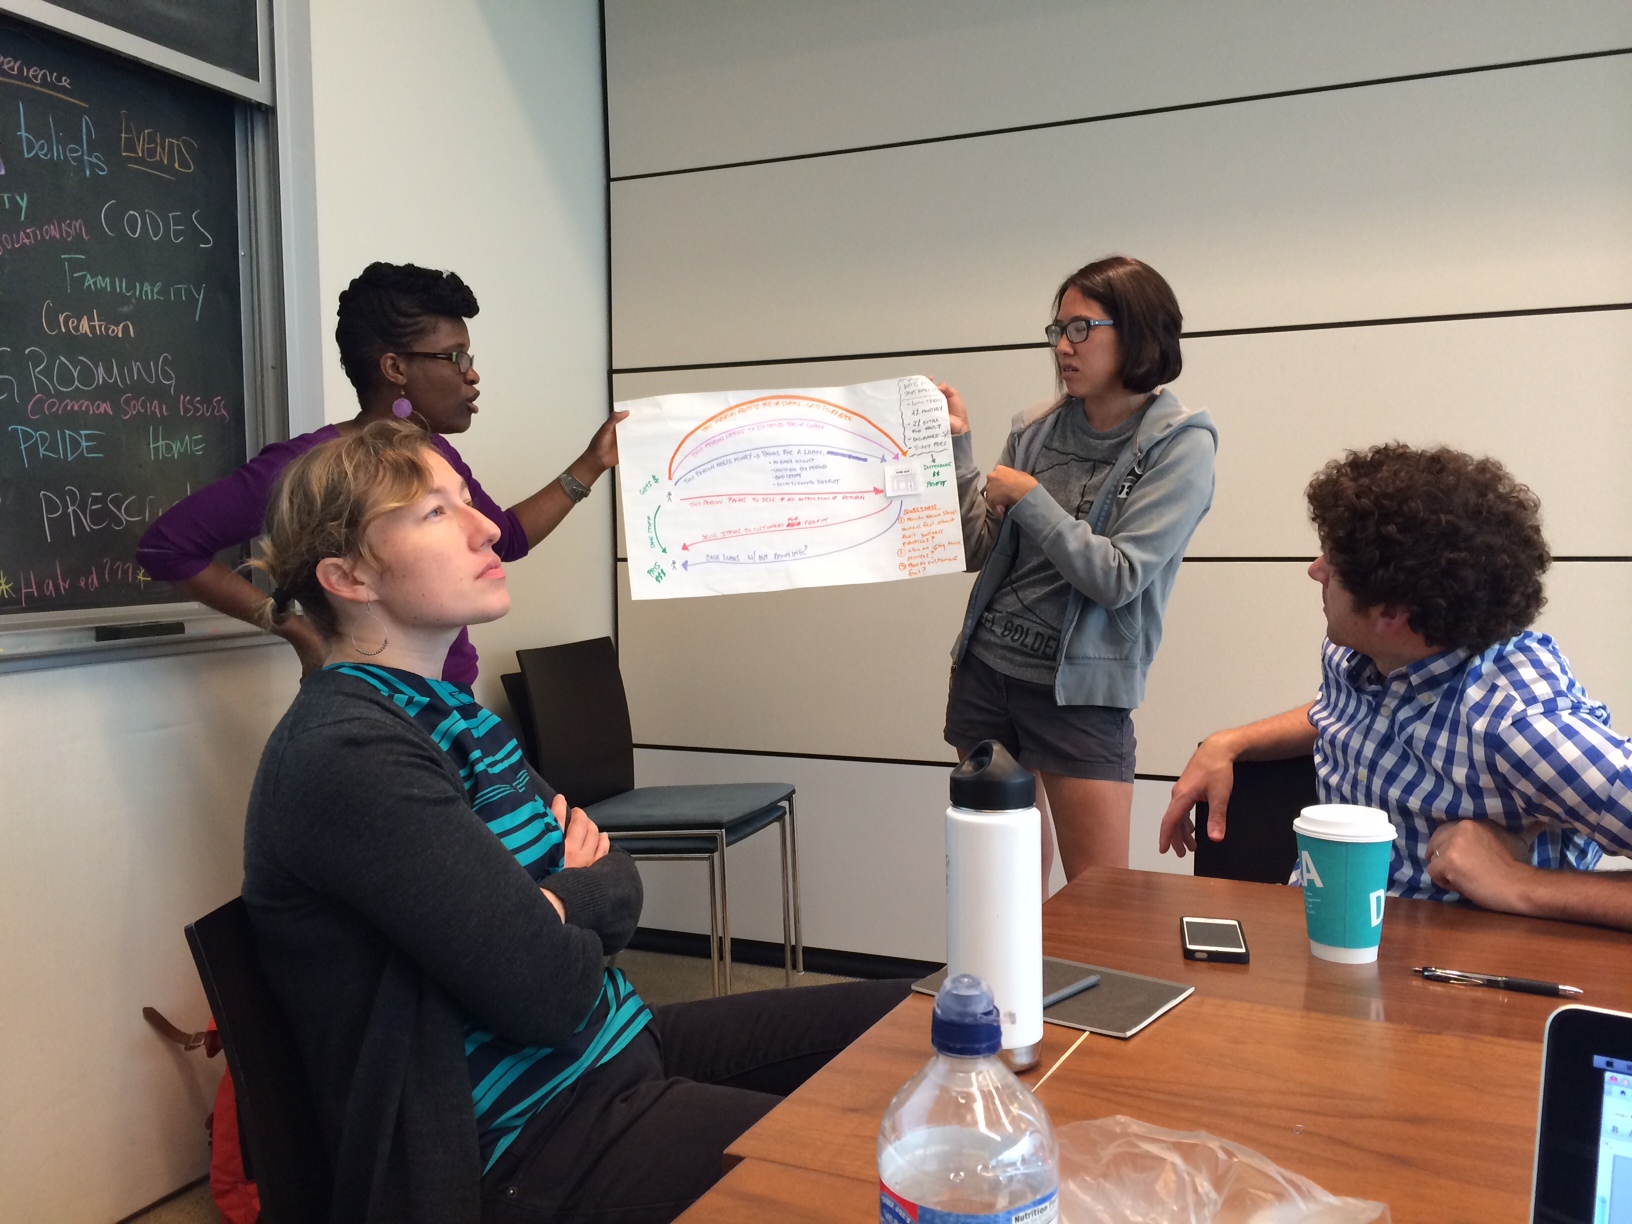
Students schooling Brooklyn College faculty.
CS: Sarah, as director of MIT’s Civic Data Design Lab, why is digital literacy increasingly important for all citizens, including high school students in Brooklyn? How do mapping and data visualization expose patterns of inequality and equity issues?
SW: Data literacy—the ability to work with, analyze, and make arguments with data—is essential in a society that increasingly depends on data to make decisions. It is, therefore, essential for the public to know how to interpret and critique policy driven from data analytics as it will affect everything from transportation logistics to homeless services. Data literacy will ensure that youth on the margins are not left behind but can engage with and critique decisions made with data. Maps are powerful tools for civic debate as they transform data locked away in text files and databases into something everyone can see and understand. Maps make data accessible to broad publics while also exposing social issues in a geographic context, allowing anyone to literally see policy issues tied to the places we live.
CS: What future plans do you have for Local Lotto? Could this project be adapted for other locations in New York and expanded to other cities in the United States?
LR: Local Lotto is being piloted in 2015 to 2016 in a college-level mathematics course at a community college in the Bronx. Local Lotto is being shared with diverse audiences, through publications in Journal of Digital and Media Literacy, Cognition & Instruction, Mathematics Teaching in the Middle School, conference publications, and presentations for teachers. The Local Lotto curriculum is available at www.citydigits.org, and we would love to hear from teachers or schools who try it out.
SW: Future ideas for City Digits include a redesign of the tool that would focus on creating an interface and resources center for teachers to develop their own modules and share those modules with the larger City Digits community. Perhaps more importantly, the network created by the tool could help broaden curriculum and resources about place-based mathematics learning using data visualization. Data literacy is not only an essential skill for youth; an educated, data-literate public can also better engage with and gain a deeper understanding about the impact of civic issues. Therefore the tool will also be expanded to users beyond the K12 community. City employees to journalists can build policy narratives with data. For example, New York City’s Department of Homeless Services might use the tool to develop a project on the spatial effects of homelessness and use the tool to collect narratives and data about homeless populations.
• City Digits material is based upon work supported by the National Science Foundation under Grant No. 1222430.
Williams worked with the Associated Press to create Beijing Air Tracks. Air-quality data was collected via sensors attached to reporters’ cell phones and reported in real time, revealing that levels of particulate matter were often thirteen to twenty times higher than World Health Organization standards (August 2008, Beijing, China).
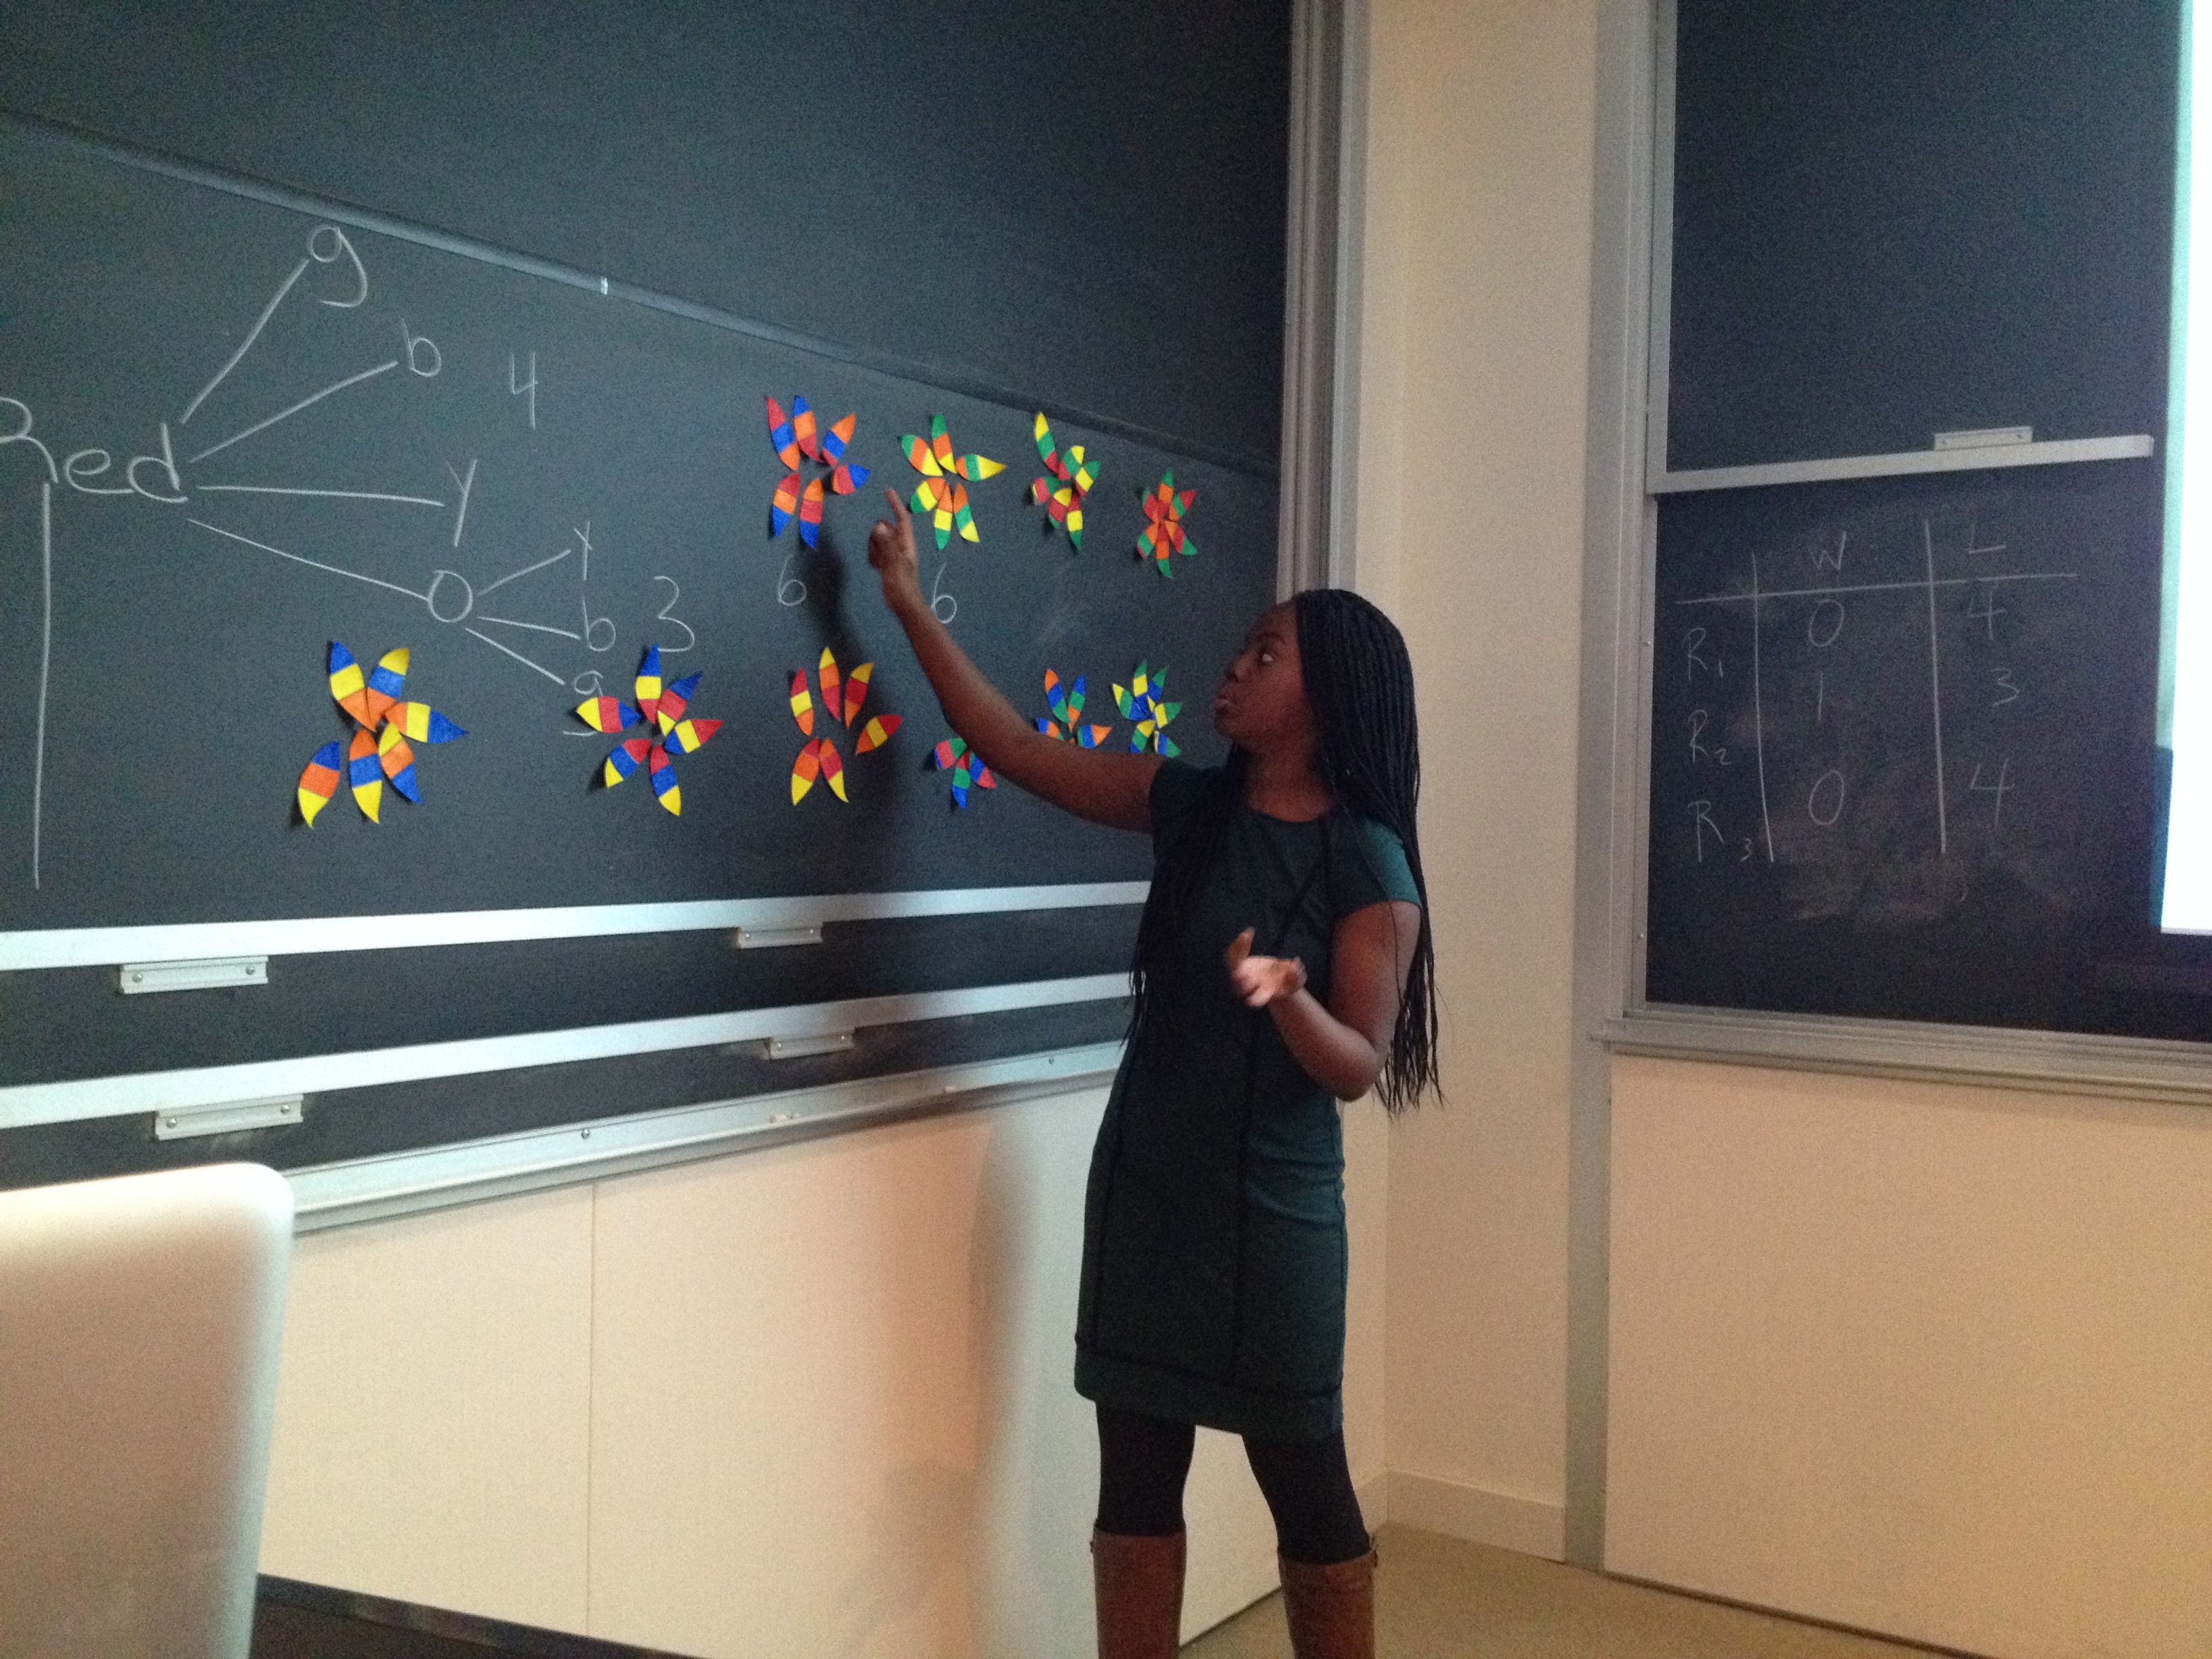
A high-school student from New York City demonstrates understanding of combinatorical mathematics at the Creating Balance in an Unjust World Conference at University High School
This interview is excerpted from the book By the People: Designing a Better America, available through SHOP Cooper Hewitt.
2 thoughts on “Mapping for Social Justice”
David on January 11, 2017 at 11:25 am
Has this project made use of the technology to model violent crime in the community? Perhaps students could create an app that would warn people when entering a high crime area…
Laurie on January 15, 2017 at 3:29 am
There are many interesting uses of maps and crowdsourcing that can improve safety in a city, like identifying street intersections that need improvements for pedestrian crossings. Youth could use geometry to describe the complexity of any given intersection as well as for potential designs for its improvement. Related to personal safety and well-being in a city, mapping can certainly be used to share or visualize information about crimes or about safety and well-being related to the local policing activities. I’m one of the City Digits project co-designers — we see great potential in place-based education!